 Review


Affiliation:
1Independent Researcher, 41100 Modena, Italy
Email: a.lonardo@libero.it
ORCID: https://orcid.org/0000-0001-9886-0698


 ,
Affiliation:
2Institute of Molecular Pathobiochemistry, Experimental Gene Therapy and Clinical Chemistry (IFMPEGKC), RWTH University Hospital Aachen, D-52074 Aachen, Germany
ORCID: https://orcid.org/0000-0003-3888-0931
Explor Med. 2026;7:1001440 DOI: https://doi.org/10.37349/emed.2026.1001440
Received: August 06, 2026 Accepted: October 18, 2026 Published: November 19, 2026
Academic Editor: Yingyong Zhao, Northwest University, China
Recent changes in steatotic liver disease (SLD) nomenclature, together with a broader view of adiposity and metabolic health, require renewed appraisal of SLD in lean individuals. This review evaluates the clinical relevance of lean nonalcoholic fatty liver disease (NAFLD), metabolic dysfunction-associated fatty liver disease (MAFLD), and metabolic dysfunction-associated SLD (MASLD) by integrating meta-analytic evidence, emerging MAFLD data, and original MASLD studies. Across definitions, while obesity is a risk factor for SLD development and progression, leanness does not confer protection. Lean NAFLD accounts for a substantial share of the global disease burden and is associated with steatohepatitis, advanced fibrosis, cirrhosis, incident diabetes, liver-related and all-cause mortality, and selected extrahepatic outcomes, despite a generally more favorable cardiometabolic profile than obesity-associated disease. Lean MAFLD is less prevalent but clinically important, with evidence of excess liver-related mortality. Early MASLD studies similarly show that body mass index (BMI) can underestimate hepatic, cardiovascular, and survival risk. Genetic, epigenetic, demographic and ethnic factors further shape disease susceptibility and progression. Overall, the evidence supports moving from weight-based classification to risk-based assessment incorporating fibrosis stage, metabolic dysfunction, visceral adiposity, sarcopenia, age, sex, ethnicity and genetic risk. Thus, ‘lean’ should not be regarded as a low-risk state, but as a phenotype in which conventional obesity metrics may obscure clinically meaningful disease. Future studies should harmonize definitions, clarify causal pathways, refine phenotyping beyond BMI, and ensure adequate representation of lean individuals in therapeutic, prognostic, and surveillance studies of all SLD variants.
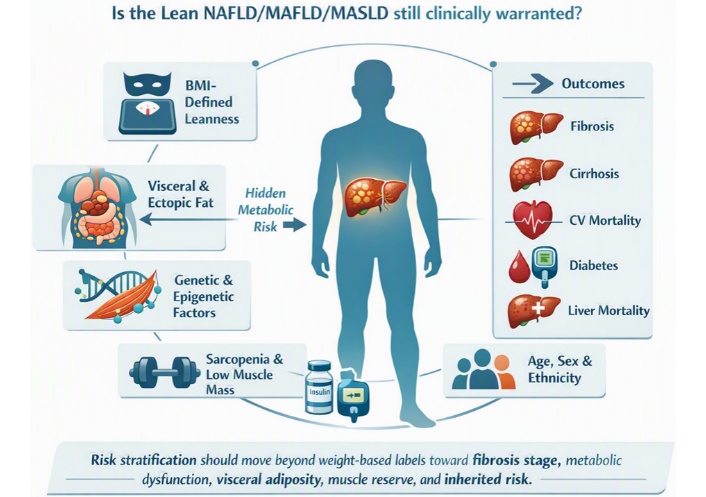
The nosography of fatty liver disease, now rephrased to steatotic liver disease (SLD), has moved from descriptive clinicopathological observation towards a metabolically anchored framework. Early accounts linked hepatic steatosis with obesity, diabetes and progressive liver injury [1], whereas the definitions of nonalcoholic steatohepatitis and nonalcoholic fatty liver disease (NAFLD) shaped clinical practice and research for almost four decades [1]. In 2020, the introduction of the novel definition of metabolic dysfunction-associated fatty liver disease (MAFLD) marked a major advancement by introducing a positive diagnostic criterion [2]. More recently, concerns about exclusionary and potentially stigmatizing terminology have supported the transition from NAFLD/MAFLD to metabolic dysfunction-associated SLD (MASLD) and steatohepatitis (MASH) [3]. This change is not merely semantic: the diagnostic frameworks for NAFLD, MAFLD and MASLD differ in their underlying principles rather than exclusively among lean individuals. Specifically, NAFLD is based on exclusion criteria, MAFLD on inclusion criteria, and MASLD on a combination of inclusion and exclusion criteria [4]. Two additional metabolic risk factors are required only in lean individuals with MAFLD, whereas overweight/obesity or type 2 diabetes fulfils the principal entry criterion, without the need for two additional metabolic risk factors. Although the adoption of MASLD has prompted thoughtful debate about transition, continuity of evidence and international harmonization [5–9], it offers a more affirmative and clinically tractable framework for risk stratification, cohort harmonization and therapeutic development. Its implementation will require careful attention to transitional language, cultural and linguistic sensitivities, improved metabolic dysfunction and alcohol-associated liver disease (MetALD) classification, education, care pathways and coding systems [10].
In parallel, obesity is increasingly conceptualized as a complex, chronic-recurrent disease and a major determinant of chronic liver disease, with MASLD representing the prototypical obesity-associated liver disorder [11]. The Diagnosis of obesity has traditionally been based on body mass index (BMI) thresholds. However, BMI is an imprecise metric, as the definitions of obesity based on BMI are ethnicity-specific and total body weight offers a crude and inaccurate assessment of the distribution of body fat [11]. It is specifically excess visceral adipose tissue—as opposed to total adiposity—that can promote steatohepatitis, fibrosis, cirrhosis, and hepatocellular carcinoma (HCC). This occurs through intersecting metabolic, inflammatory, fibrogenic and carcinogenic pathways, including lipotoxicity, adipokine dysregulation, oxidative and endoplasmic reticulum stress, intestinal dysbiosis and perturbation of the gut–liver axis [11]. Conceptually, this field is also moving beyond a BMI-centered approach: the recent distinction between pre-clinical and clinical obesity emphasizes the amount, distribution and biological impact of adiposity as determinants of metabolic health [11, 12]. Within this evolving scenario, the construct of “lean NAFLD”—more precisely, NAFLD in lean individuals [13]—requires renewed scrutiny. Early reports emerged from West Bengal, India, where Das et al. [14] identified substantial NAFLD and cryptogenic cirrhosis in a predominantly non-obese, non-affluent population. Subsequent observations in Europe and the United States confirmed that the lean NAFLD phenotype also occurs in populations with high obesity prevalence [15, 16], underscoring that BMI-defined obesity is not a prerequisite for the development of SLD.
This review reassesses the clinical and scientific value of the lean NAFLD/MAFLD/MASLD construct at a moment when two fields are being redefined: SLD nomenclature and the concept of obesity itself. The rationale is clear. If MAFLD and MASLD are anchored in metabolic dysfunction, and obesity is no longer reducible to BMI, then “lean” cannot be tentatively assumed to indicate metabolic protection or low liver-related risk. We therefore examine published studies to discuss whether lean NAFLD/MASLD remains a distinct and useful nosography category, or whether it is better understood within broader frameworks that integrate body composition, visceral and ectopic adiposity, age, sex, ethnicity, cardiometabolic risk, genetic susceptibility and clinical outcomes. The aims of our review article are to clarify the biological and clinical meaning of this phenotype, assess its relevance for diagnosis, prognosis and research design, and help align terminology with the evolving pathophysiology of SLD.
To accommodate the recent transition in disease nomenclature while preserving continuity with the existing literature, we conducted two complementary PubMed searches on July 4, 2026.
The first search used the string (Lean[Title]) AND (NAFLD[Title/Abstract]) and was restricted to meta-analyses. This strategy identified 20 records; after exclusion of research letters, narrative reviews, and commentaries, 18 eligible articles were retained for analysis (Table 1) [17–34].
Meta-analytic reviews on the epidemiological and clinical features of lean NAFLD.
| Author, year, [ref] | Method | Findings | Conclusion |
|---|---|---|---|
| Li et al., 2026 [17] | The analysis included 54 studies involving 146,714 patients with lean or non-obese NAFLD. | Among patients with lean or non-obese NAFLD, pooled global diabetes prevalence was 15.6% (95% CI 10.8–22.7%), highest in South America at 41.3% (CI 39.1–43.5%). Geographic region and mean age (p < 0.05) explained 51.61% of heterogeneity. Prediabetes prevalence was 22.9% (95% CI 12.5–41.9%), highest in Europe at 34.4% (CI 23.0–51.4%); geographic region and country (p < 0.05) explained 73.65% of heterogeneity. | Overall, the pooled global prevalence of diabetes and prediabetes among lean or non-obese patients with NAFLD was 15.6% and 22.9%, respectively. These findings highlight the potential value of considering routine diabetes screening in this patient population. |
| Miao et al., 2025 [18] | Fourteen studies were included, including ten retrospective cohort studies. | Compared to high-BMI NAFLD, lean NAFLD was associated with higher all-cause mortality (HR 1.34, 95% CI: 1.23–1.47) and liver disease-related mortality (HR 2.14, 95% CI: 1.18–3.87). However, it was not associated with increased cardiovascular (HR 0.92, 95% CI: 0.65–1.30) or cancer-related mortality (HR 1.20, 95% CI: 0.90–1.60). | Lean NAFLD patients exhibit higher risk of all-cause, and liver disease-related mortality compared to patients with high BMI. There is a need for tailored interventions and further research to understand specific mortality risks in this subgroup of patients. |
| Fatima et al., 2024 [19] | Twenty-five studies were included in the analysis. | Compared to obese NAFLD, lean NAFLD was associated with lower risks of diabetes mellitus (RR 0.78, 95% CI 0.71–0.87, p < 0.00001), dyslipidemia (RR 0.87, 95% CI 0.79–0.95, p = 0.002), arterial hypertension (RR 0.80, 95% CI 0.74–0.87, p < 0.00001) and metabolic syndrome (RR 0.45, 95% CI 0.31–0.64, p < 0.00001). Lipid profile, blood pressure and other clinical parameters were also more favorable in the lean NAFLD group. | Lean NAFLD is associated with lower metabolic diseases, FBG, BP, and a more favorable lipid profile compared to obese NAFLD. |
| Souza et al., 2024 [20] | This metanalysis included 22 studies with over 1 million NAFLD patients (13.0% were lean). | Lean NAFLD was associated with higher LRM (RR 2.22, 95% CI 1.57–3.15; HR 2.26, 95% CI 1.14–4.51). In contrast, cardiovascular risk was lower only in unadjusted analyses (RR 0.82, 95% CI 0.70–0.95) and was comparable after adjustment (HR 0.89, 95% CI 0.77–1.02), with no clear difference in cardiovascular mortality (RR 1.09, 95% CI 0.71–1.66; HR 1.26, 95% CI 0.89–1.78) vs. non-lean NAFLD. | Compared to non-lean NAFLD patients, lean NAFLD subjects exhibit worse liver outcomes, but similar CV outcomes highlighting the importance of closely monitoring NAFLD individuals irrespective of their BMIs. |
| Wongtrakul et al., 2024 [21] | Fourteen studies were included, comprising 94,181 patients with NAFLD, of whom 11.3% were lean, and 7,443 deaths over a median follow-up of 8.4 years. | Lean NAFLD was associated with increased all-cause mortality compared to non-lean NAFLD (random-effects HR 1.61, 95% CI 1.37–1.89; I2=77%). This association was consistent across stratified and sensitivity analyses and remained independent of age, sex and cardiometabolic risk factors, with no evidence of significant publication bias. | Lean NAFLD is associated with an approximately 1.6-fold higher mortality risk, supporting further mechanistic studies to clarify the complex relationship between lean NAFLD and excess mortality. |
| Souza et al., 2024 [22] | Eight studies totaling 56,745 NAFLD individuals (11% with lean NAFLD) and 704 cases of incident GI cancers were included. | Compared to non-lean NAFLD, lean NAFLD was associated with higher risks of hepatic (RR 1.77, 95% CI 1.15–2.73), pancreatic (RR 1.97, 95% CI 1.01–3.86) and colorectal cancers (RR 1.53, 95% CI 1.12–2.09), whereas risks of esophageal, gastric, biliary and small intestinal cancers did not differ significantly. | Lean NAFLD is associated with increased risks of liver, pancreatic and colorectal cancers, supporting tailored prevention strategies and further mechanistic research. |
| Zhang et al., 2023 [23] | The final analysis included 25 studies, comprising 229,091 lean or non-obese Chinese adults, of whom 22,641 had NAFLD. The pooled prevalence of NAFLD was 8.98% (95% CI 5.55–13.13) among lean participants and 13.77% (95% CI 11.13–16.63) among non-obese participants. | Compared to overweight or obese NAFLD, lean or non-obese NAFLD showed a more favorable cardiometabolic profile, including lower blood pressure (128.86/80.48 vs. 136.09/84.98 mmHg), WC (80.63 vs. 92.73 cm), FBG (5.53 vs. 5.69 mmol/L) and triglycerides (1.63 vs. 1.94 mmol/L), with higher HDL cholesterol (1.33 vs. 1.26 mmol/L). | Lean or non-obese NAFLD is generally associated with a more favorable metabolic profile than overweight or obese NAFLD. |
| Huang et al., 2024 [24] | 12 studies (totaling n = 26,329 individuals), 7 of which (n = 7,924) were used to evaluate the risk of all-cause mortality between lean and non-lean NAFLD patients. | Lean NAFLD subjects had a higher risk of death compared to non-lean patients (RR = 1.39, 95% CI 1.08–1.82, heterogeneity: I2 = 43%). Among the lean NAFLD population, all-cause mortality was 13.3 (95% CI: 6.7–26.1) per 1,000 person-years, 3.6 (95% CI: 1.0–11.7) for LRM and 7.7 (95% CI: 6.4–9.2) for CV-related mortality. The incidence of new-onset diabetes was 13.7 (95% CI 8.2–22.7) per 1,000 person-years, new-onset HTN was 56.1 (95% CI: 40.2–77.9), cirrhosis was 2.3 (95% CI: 1.0–5.0), and cancer was 25.7 (95% CI: 20.3–32.4). | Lean NAFLD is associated with higher all-cause mortality than non-lean NAFLD, indicating that BMI alone should not determine follow-up or treatment decisions. |
| Gao et al., 2023 [25] | This metanalysis included a total of 16 observational studies with 304,975 adult individuals (7.7% with lean NAFLD) followed up over a median period of 5.05 years. | Patients with lean NAFLD had a greater risk of incident diabetes than those without NAFLD (random-effects HR 2.72, 95% CI 1.56–4.74; I2 = 93.8%). Compared to the lean without NAFLD group, the aHRs of incident diabetes for those in the overweight/obese without NAFLD and overweight/obese with NAFLD groups were 1.32, CI 0.99–1.77) and 2.98, CI 1.66–5.32. NAFLD patients with high NFS had even greater risks (random-effects HR 3.48, 95% CI 1.92–6.31). | Lean NAFLD is associated with an approximately twofold higher risk of incident diabetes in non-overweight individuals, with risk increasing alongside NAFLD severity. These findings suggest that hepatic steatosis may confer a greater diabetogenic risk than excess body weight alone. |
| Ha et al., 2023 [26] | 10 cohort studies involving 109,151 NAFLD patients were analyzed. | Compared to non-lean NAFLD counterparts, lean NAFLD subjects had comparable risks for all-cause mortality (RR, 1.09, 95% CI, 0.66–1.90), CV mortality (RR, 1.12; 95% CI, 0.66–1.90), and adverse liver events including decompensated cirrhosis and HCC (RR, 0.81; 95% CI, 0.50–1.30). However, the risk of LRM was higher in patients with lean than non-lean NAFLD (RR, 1.88, 95% CI 1.02–3.45). | Lean NAFLD is associated with excess LRM compared with non-lean NAFLD, underscoring the need to define the mechanisms, prognostic factors and genetic or ethnic modifiers that should inform individualized management strategies. |
| Tang et al., 2023 [27] | This meta-analysis included 85 articles. | NAFLD in lean accounted for 13.11%, 95% CI 10.26–16.62% of the global population and 14.55%, 95% CI 11.32–18.51% in Asia. Significantly less metabolic dysfunction was found in lean NAFLD subjects than in NAFLD in overweight counterparts. For lean NAFLD only 19.56% (95% CI, 15.28–24.69%) of the subjects were diabetic, vs. 45.70% (95% CI, 35.01–56.80%) of obese subjects with NAFLD had diabetes (p < 0.01). | These findings emphasize the weight-dependent gradient of metabolic dysfunction in NAFLD: lean individuals are metabolically healthier than overweight or obese counterparts yet remain within the disease spectrum. Definitions that rely too heavily on metabolic dysfunction may therefore overlook established lean NAFLD phenotypes. |
| Alam et al., 2021 [28] | This study processed 22 studies totaling lean (n = 6,768) and obese (n = 9,253) patients with NAFLD were analyzed. Lean (n = 43,398) and obese (n = 9,619) subjects without NAFLD served as controls. | Compared to lean non-NAFLD controls, lean NAFLD was associated with higher adiposity, BP, glycemic indices and insulin resistance, including FBG (MD 5.17 mg/dL, 95% CI 4.14–6.16), HbA1c (MD 0.29%, 95% CI 0.11–0.48) and HOMA-IR (MD 0.49 U, 95% CI 0.29–0.68). Lipid parameters and uric acid were also generally increased, whereas HDL cholesterol was not. Across BMI strata, the most consistent NAFLD-associated differences involved DBP (slope 0.19, p < 0.037), HOMA-IR (slope 0.58, p < 0.001) and uric acid (slope 0.36, p = 0.022). | Lean and non-lean NAFLD appear to share overlapping metabolic features and risk determinants, supporting the view that lean NAFLD lies within the broader spectrum of metabolic liver disease. |
| Ito et al., 2021 [29] | Seventy-three eligible studies were included (n = 258,531). Pooled estimates were calculated using random-effects models, whereas trends and forecasts were evaluated with Bayesian modelling. Individual patient data were obtained for 14,887 participants from eight studies, including 7,752 with NAFLD and 7,135 without NAFLD. | NAFLD prevalence was 25.5% and is projected to reach 39.3% by 2030 and 44.8% by 2040. Incidence rates for NAFLD, HCC and all-cause mortality were 23.5, 7.6 and 5.9 per 1,000 person-years, respectively. Lean NAFLD accounted for 20.7% of NAFLD cases and was associated with higher mortality than non-lean NAFLD (8.3 vs. 5.6 per 1,000 person-years; p = 0.02), although lean status was not an independent mortality predictor. | In Japan, NAFLD prevalence has risen substantially and is projected to approach 45% by 2040. Lean NAFLD accounts for approximately one-fifth of cases and is associated with older age and higher mortality. |
| Lu et al., 2020 [30] | Thirty-three observational studies were included, totaling 205,307 individuals from 14 countries. | The global prevalence of lean NAFLD was 4.1% (95% CI: 3.4–4.8%) and reached 9.7% (95% CI: 7.7–11.8%) among lean individuals. Prevalence increased between 1988 and 2017, was highest in Asia (4.8%, 95% CI: 4.0–5.6%) and in middle-aged adults (45–59 years; 4.4%, 95% CI: 3.2–5.5%), and metabolic complications increased progressively from lean non-NAFLD to lean NAFLD and overweight/obese NAFLD. | Lean NAFLD is a prevalent phenotype associated with metabolic complications, with the highest burden reported among middle-aged individuals in Asian populations. |
| Ye et al., 2020 [31] | Ninety-three studies from 24 countries or regions were included (n = 10,576,383): 84 studies contributed to prevalence estimates, five to incidence analyses and eight to outcome analyses. | Within the NAFLD population, 19.2% (95% CI 15.9–23.0) were lean and 40.8% (36.6–45.1) were non-obese. In the general population, non-obese and lean NAFLD affected 12.1% (9.3–15.6) and 5.1% (3.7–7.0), respectively. Among individuals with non-obese or lean NAFLD, 39.0% had NASH, 29.2% had significant fibrosis and 3.2% had cirrhosis. Key incident outcomes per 1,000 person-years included NAFLD in non-obese individuals (24.6), all-cause mortality (12.1), LRM (4.1), new-onset diabetes (12.6), cardiovascular disease (18.7) and hypertension (56.1). | Non-obese individuals account for approximately 40% of the global NAFLD population, and nearly one-fifth are lean. These phenotypes carry substantial long-term hepatic and extrahepatic morbidity, indicating that obesity alone is an insufficient basis for NAFLD screening and that clinical trials should include participants across the full BMI spectrum. |
| Shi et al., 2019 [32] | Analysis included 45 studies comprising 55,936 lean or non-obese individuals, of whom 7,351 had NAFLD. | Pooled NAFLD prevalence was 10.2% (95% CI: 7.6–13.6%) in lean populations and 15.7% (95% CI: 12.5–19.6%) in non-obese populations, with lower estimates in Eastern than Western studies and an upward trend over time. Compared with non-lean or obese NAFLD, lean or non-obese NAFLD was associated with lower hypertension, uric acid and FBG levels, and higher HDL cholesterol. | Lean and non-obese NAFLD variants are common and clinically relevant across Eastern and Western populations. Better characterization of epidemiology and clinical profile should support more targeted care pathways and intervention strategies. |
| Sookoian et al., 2018 [33] | Eight studies were assessed that compared histological outcomes in lean (n = 493) vs. overweight/obese (n = 2,209) subjects. | Compared to lean NAFLD, overweight or obese NAFLD was associated with higher fibrosis scores (MD 0.28 ± 0.13; p = 0.032), NAFLD activity (0.58 ± 0.16; p = 0.0004) and steatosis (0.23 ± 0.07; p = 0.002). NASH was less frequent in lean NAFLD than in overweight or obese NAFLD (OR 0.58, 95% CI 0.34–0.97; 322 vs. 1,357 cases; p = 0.04). | Lean NAFLD is generally associated with less severe histological features than overweight or obese NAFLD. Longitudinal data are needed to define the clinical implications, although the ~25% higher mean fibrosis score in overweight or obese NAFLD suggests a potentially worse long-term prognosis. |
| Sookoian et al., 2017 [34] | A meta-analysis of 15 studies was performed together with data from the present cohort (n = 336 patients). Data from lean (n = 1,966) and obese (n = 5,938) patients with NAFLD were analyzed; lean (n = 9,946) and obese (n = 6,027) individuals without NAFLD served as controls. | Compared to lean non-NAFLD controls, lean NAFLD was associated with older age (3.79 ± 0.72 years, p = 1.36 × 10⁻⁶), higher FBG (6.44 ± 1.12 mg/dL, p = 10–10), HOMA-IR (0.52 ± 0.094-unit increment), triglycerides (48.37 ± 3.6, p = 10–10), BP and WC (5.88 ± 0.4 cm, p = 10–10). Alterations were greater in obese individuals, and meta-regression suggested that NAFLD modifies blood lipid levels. | Lean NAFLD shares metabolic and CV abnormalities with obesity-associated NAFLD, despite normal body weight. Excess abdominal adiposity and other features of metabolic syndrome remain central to this phenotype. |
aHR: adjusted hazard ratio; BMI: body mass index; BP: blood pressure; CI: confidence interval; CV: cardiovascular; FBG: fasting blood glucose; GI: gastrointestinal; HTN: arterial hypertension; HbA1c: glycated hemoglobin; HCC: hepatocellular carcinoma; HDL: high density lipoprotein; HOMA-IR: homeostasis model assessment of insulin resistance; HR: hazard ratio; MD: mean difference; NAFLD: nonalcoholic fatty liver disease; NFS: NAFLD fibrosis score; LRM: liver-related mortality; WC: waist circumference.
Next, we assessed the string (Lean[Title]) AND (MAFLD[Title/Abstract]) utilizing two filters: meta-analysis and humans to increase specificity. This strategy retrieved only one article [35].
Finally, we used the string (Lean[Title]) AND (MASLD[Title/Abstract]) and retrieved 88 records. Following the same exclusion criteria—research letters, narrative reviews, editorials and commentaries—8 original articles were considered suitable for synthesis (Table 2) [36–43].
Recent original studies and metanalytic reviews on the epidemiological and clinical features of lean MASLD.
| Author, year, [ref] | Methods | Findings | Conclusion | Limitations |
|---|---|---|---|---|
| Miller et al., 2026 [36] | This multicenter analysis included 3,386 adults with biopsy-confirmed MASLD enrolled in prospective NASH Clinical Research Network studies between 2004 and 2024. Centrally reviewed liver histology was compared across BMI categories, including ethnicity-adjusted thresholds for Asian participants. Clinical risk factors, metabolic comorbidities, PNPLA3 genotype and histological outcomes, including steatohepatitis, NAFLD Activity Score, advanced fibrosis and cirrhosis, were assessed using regression and standard group-comparison methods. | Normal-weight and overweight MASLD showed comparable histological severity, with identical rates of definite steatohepatitis, advanced fibrosis and cirrhosis. Histological severity increased mainly at BMI ≥ 30 kg/m2, suggesting obesity as a threshold for greater liver injury rather than a linear gradient across lower BMI categories. In normal-weight MASLD, advanced fibrosis was associated with older age, type 2 diabetes, hypertension, metabolic syndrome and enrichment for homozygous PNPLA3 G-allele carriage. Liver-related events were infrequent during follow-up. | Normal-weight and overweight MASLD appear histologically similar, whereas more severe disease emerges predominantly with obesity. These findings suggest that lean and overweight MASLD may represent a shared non-obese phenotype and challenge the use of “lean MASLD” as a distinct clinical category. Metabolic and genetic factors, rather than BMI alone, seem to drive fibrosis risk in normal-weight individuals. | The biopsy-based design may introduce referral and selection bias, as participants were recruited from tertiary centers and clinical studies. The normal-weight subgroup was small, limiting precision for subgroup analyses and rare liver-related outcomes. Event analyses were constrained by few liver-related events and limited adjustment for confounders, and the cohort composition may restrict generalizability to broader community-based or ethnically diverse MASLD populations. |
| Wang et al., 2026 [37] | Lean NHANES adults were assessed for MASLD using CAP and metabolic criteria; MLM-selected predictors were validated in an independent NHANES cohort with survey-weighted and subgroup analyses. | WWI emerged as the leading predictor of lean MASLD, showing an independent association and a non-linear risk increase above ~11 cm/√kg. | In lean adults, WWI may refine MASLD risk stratification by capturing central-adiposity-related risk beyond BMI. | The cross-sectional NHANES design, CAP-based steatosis assessment, residual confounding, limited generalizability, and the need for prospective validation limit the methodology of the study. |
| Chowdhary et al., 2026 [52] | This multicenter retrospective TriNetX cohort study identified 1,130,297 adults with non-cirrhotic MASLD from 2010 to 2024, including n = 229,084 (20.27%) with lean MASLD (BMI < 25 kg/m2). Incident fibrosis, cirrhosis, portal hypertensive complications, HCC, liver transplantation and all-cause mortality were assessed over 3-, 5-, and 10-year follow-up. | After propensity matching, lean MASLD showed higher risks of fibrosis, cirrhosis, portal hypertensive complications, HCC, liver transplantation and mortality than non-lean MASLD across follow-up intervals. In lean MASLD, older age, diabetes, hypoalbuminemia, thrombocytopenia and elevated AST independently predicted adverse hepatic outcomes. | Lean MASLD is associated with substantial long-term hepatic morbidity and mortality. These findings suggest that BMI-centered screening and risk-stratification strategies may overlook clinically relevant disease in lean individuals, supporting more inclusive approaches to surveillance. | Key limitations include the retrospective EHR-based design, potential selection and coding bias, residual confounding despite matching, and possible misclassification of MASLD status and liver outcomes. The BMI-based definition of lean MASLD may not reflect body composition or visceral adiposity. Differential surveillance and limited generalizability across populations and health care settings should also be considered. |
| Al Ta’ani et al., 2026 [38] | TriNetX data were used to compare CV, cerebrovascular and mortality outcomes in lean MASLD, defined as BMI < 25 kg/m2, after propensity-score matching and Cox modelling over up to 7 years. | After matching 67,519 patients per group, lean MASLD was associated with higher 7-year risks of HF, CVE, CBVE and all-cause mortality, with HRs ranging from 1.21 to 1.48 and 95% CIs excluding unity; excess risk was also evident at 1, 3 and 5 years. | Lean MASLD is associated with greater CV and mortality risk than non-lean MASLD. | The study is limited by the retrospective TriNetX design, reliance on coded EHR data, potential misclassification and residual confounding, limited granularity on liver disease severity and event adjudication, and uncertain generalizability across health-care settings. |
| Kasar et al., 2025 [53] | This NHANES 2017–2020 cross-sectional analysis included 1,707 lean adults with metabolic dysfunction, using ethnicity-specific BMI thresholds. Diet quality was assessed with the HEI-2015. | Higher diet quality was associated with lower odds of lean MASLD; participants in the highest HEI quartile had 66% lower odds than those in the lowest quartile. Protein and refined-grain intake were positively associated with MASLD, whereas oil intake appeared protective. | Better overall diet quality was associated with reduced lean MASLD risk, highlighting diet composition as a potentially modifiable factor in lean individuals and supporting further mechanistic and longitudinal studies. | The cross-sectional NHANES design precludes causal inference or assessment of temporality between diet quality and lean MASLD. Dietary intake was self-reported and may be affected by recall or reporting bias, while residual confounding from genetic, psychosocial or socioeconomic factors cannot be excluded. In addition, the available dietary and diagnostic measures may not fully capture nutrient subtype effects or the histological spectrum of MASLD. Finally, generalizability beyond US populations and the study-defined lean BMI category may be limited. |
| Njei et al., 2025 [39] | NHANES 2017–March 2020 data were used to estimate nationally representative lean MASLD prevalence among adults with valid elastography, excluding viral hepatitis and significant alcohol use; MASLD was defined by CAP ≥ 274 dB/m and lean status by BMI < 25 kg/m2 (< 23 kg/m2 in Asian individuals). | Lean MASLD affected an estimated 6.4% of U.S. adults, corresponding to 3.8 million people, of whom 34.6% were undiagnosed; prevalence rose markedly with glycemic dysfunction, reaching 33% in lean individuals with diabetes. | Lean MASLD is common and frequently underdiagnosed among adults in the USA, highlighting the need for refined screening and risk-stratification strategies in metabolically at-risk lean populations. | Limitations include the cross-sectional NHANES design, CAP-based MASLD ascertainment, self-reported diagnostic status, residual confounding, and limited precision for subgroup analyses in lean MASLD. |
| Zhang et al., 2025 [54] | In this population-based NHANES cohort of 14,740 adults, advanced fibrosis was assessed using NFS or FIB-4. | Over a median follow-up of 7.3 years, lean MASLD was associated with higher all-cause and diabetes-specific mortality than non-lean MASLD, whereas CV- and cancer-specific mortality did not differ significantly. Advanced fibrosis modified this risk, with particularly high mortality rates observed among lean individuals with fibrosis. Elevated FIB-4 or NFS identified lean MASLD patients at increased mortality risk. | Lean MASLD patients exhibited greater risks of all-cause and diabetes-specific mortality than non-lean MASLD patients. Noninvasive fibrosis assessment is recommended in lean MASLD patients. | The use of laboratory-based markers may have introduced misclassification or selection bias, while the limited number of participants and deaths within subgroups may have reduced statistical precision. Residual confounding, (e.g., underreported alcohol intake), cannot be excluded, and reliance on ICD-coded causes of death may have led to outcome misclassification. LRM was unavailable. Finally, the findings should be generalized cautiously to other populations. |
| Tesfai et al., 2026 [55] | Cross-sectional analysis of prospectively enrolled 312 adults with MASLD. Lean MASLD subjects (n = 44 = 14.1%) were age- and sex-matched with non-lean MASLD. Fibrosis assessment included vibration-controlled transient elastography, magnetic resonance elastography and liver biopsy. A GRS, summating the effect alleles of PNPLA3 and TM6SF2 minus the protective HSD17B13 genotype, was estimated to consider inherited genetic risk across BMI categories. Results were validated in an external Latin American cohort. | A high GRS compared to a low GRS was associated with a greater prevalence of significant fibrosis (36.5% vs. 25.2%; p = 0.043). Among individuals with a high GRS, fibrosis prevalence did not differ significantly between lean and non-lean patients (31.3% vs. 37.1%; p = 0.645), a pattern that was recapitulated in the Latin American cohort. | The prevalence of significant fibrosis and the effect of GRS were similar in lean and non-lean MASLD, highlighting that lean MASLD patients may have a comparable risk to overweight and obese MASLD. | Limitations include the small number of lean MASLD participants, which limits statistical power and precludes robust subgroup analyses. Although deep phenotyping supports accurate case classification, prior BMI trajectories, differences in fibrosis assessment methods between cohorts, limited representation of Asian populations, and the absence of longitudinal liver stiffness data may affect interpretation and generalizability. |
| Huo et al., 2026 [40] | This prospective multicohort study included 153,192 patients with MASLD from UKB, 29,700 from the Kailuan cohort, and 3,329 from CKB. Lean MASLD was defined as BMI< 23 kg/m2 in Kailuan and CKB and < 25 kg/m2 in UKB. Primary endpoints were LREs, all-cause mortality, LRM, CVD mortality, CVD, HCC, and EHC. | Across 181,191 non-lean and 5,030 lean patients with MASLD followed for a median of 14.2 years, lean MASLD was associated with higher risks of LREs (HR 2.14), all-cause mortality (HR 1.26), LRM (HR 2.31) and CVD mortality (HR 1.22), but lower incident CVD risk (HR 0.89) and no clear increase in HCC or EHC. | Lean MASLD appears to confer an excess burden of adverse liver outcomes and all-cause mortality, while risks of HCC and EHC remain comparable and incident CVD risk is lower. | This long-term prospective multicohort study is observational and cannot establish causality; heterogeneity in cohort design, MASLD ascertainment, covariates and outcome capture, together with limited data on body composition, lifestyle, genetic risk, disease severity and treatment exposure, may contribute to residual confounding. |
| Hsu et al., 2025 [56] | This Taiwan Biobank study integrated genomic data with ultrasound-defined steatosis to identify lean MASLD among individuals with BMI < 23 kg/m2. GWAS was performed in 1,720 lean MASLD cases and 5,331 lean controls, adjusting for demographic and ancestry-related covariates, with conditional analyses used to define independent loci and replication undertaken in the All of Us cohort. | Lean MASLD was characterized by adverse metabolic features and a strong genetic signal at the PNPLA3–SAMM50 locus. The PNPLA3 variant rs9625962 emerged as the lead independent association and was replicated in the All of Us cohort, with risk conferred across BMI strata. In lean MASLD, higher metabolic risk scores also correlated with FIB-4 and NFS, linking metabolic burden to fibrosis risk. | In the Taiwan Han Chinese population, rs9625962 showed pleiotropic effects on MASLD across BMI categories, triglyceride levels and liver-test profiles. Replication in the All of Us cohort supports the robustness and broader relevance of these variants, underscoring a genetic contribution to lean MASLD pathogenesis. | Key limitations include incomplete ascertainment of MASLD-related metabolic criteria, missing viral hepatitis and lifestyle data, limited generalizability beyond the cohort in Taiwan, and reliance on BMI alone to define lean status. |
| Sato-Espinoza et al., 2025 [57] | Case-control study including 177 lean non-alcoholic SLD cases (47 cryptogenic, 130 MASLD), 677 matched lean controls, and 3,090 overweight/obese SLD cases in the Mayo Clinic Biobank and Tapestry databases. | Lean non-alcoholic SLD was associated with an intermediate metabolic and genetic risk profile between lean controls and overweight or obese SLD, with diabetes emerging as an independent predictor. Within lean SLD, MASLD was linked to GCKR risk-allele homozygosity, whereas FIB-4 retained good performance for identifying advanced fibrosis. | Diabetes is a key predictor of non-alcoholic SLD in lean individuals, supporting SLD screening irrespective of BMI. GCKR variation may contribute to lean MASLD, whereas the determinants of cryptogenic SLD remain unresolved. | Its retrospective design supports association rather than causation, and case ascertainment, diagnostic variability, and self-reported alcohol intake may have introduced misclassification. Limited diversity, the absence of an external validation cohort, and the use of a single BMI threshold further constrain generalizability. |
| Njei et al., 2025 [58] | Cross-sectional study including 860 lean adults (median age 53 years; 48% female; 38% White; mean BMI 22.5 kg/m2). | The age-adjusted prevalence of MASLD was 8.9%. Among individuals with MASLD, 84% had a high visceral adiposity index (> 1.92). The percent change in CAP associated with HOMA-IR, QUICKI, and HOMA-β was 11.62, 95% CI: 6.31–16.93), 0.76 (95% CI: 0.26–1.26), and –162.72 (95% CI: –260.94 to –64.50), respectively. HOMA-IR (aOR: 2.60, 95% CI: 1.36–4.98), QUICKI (aOR: 1.06, 95% CI: 1.01–1.11), and HOMA-β (aOR: 0.04, 95% CI: 0.01–0.56) were each associated with MASLD. HOMA-IR was associated with advanced liver fibrosis (aOR: 1.51, 95% CI: 1.19–2.15). | Lean MASLD affected 8.9% of US adults and was strongly linked to visceral adiposity and insulin resistance; HOMA-IR was also independently associated with advanced fibrosis. | The cross-sectional design precludes causal inference, and generalizability beyond the US population remains uncertain. Insulin resistance was assessed using surrogate fasting indices rather than dynamic methods, residual confounding cannot be excluded, and MASLD and advanced fibrosis were diagnosed non-invasively. |
| Rotaru et al., 2025 [41] | This observational study assessed 1,438 adults with metabolic and hepatic profiling, including VCTE-CAP. In normal-weight participants (BMI < 25 kg/m2), CUN-BAE and other non-invasive indices were evaluated, and multivariable regression identified predictors of steatosis and fibrosis. | Among normal-weight individuals, MASLD prevalence was 19.28% and was accompanied by substantial metabolic dysfunction; CUN-BAE independently predicted steatosis, whereas conventional non-invasive scores showed only moderate discrimination in lean phenotypes. | In Eastern Europe lean MASLD is clinically relevant, supporting the integration of visceral adiposity measures and advanced non-invasive liver assessment to improve detection and risk stratification. | Interpretation should consider the small single-center lean cohort, VCTE-based MASLD assessment, cross-sectional design and possible residual confounding related to lifestyle, treatment exposure, disease activity, body composition, genetic risk and metabolic factors. |
| Ghani et al., 2025 [59] | Seventy-five thousand nine hundred twenty-one patients (with 5% lean individuals) were included in this retrospective multicenter study on patients with MASLD at the Banner and the University of Michigan Health systems from 2012 to 2023. | After adjusting for confounders, lean individuals had a higher mortality, higher incidence of CVD, and higher incidence of MALO. | Lean individuals have a higher mortality, higher cardiovascular burden, and higher incidence of MALO compared to non-lean individuals. Further studies are warranted to explore lean patients with MASLD, and interventions are needed to decrease mortality in this patient population. | In this retrospective cohort study all diagnoses (MASLD, CVD, metabolic diseases, cirrhosis, MACE, and MALO, were mainly based on ICD codes. Unmeasured confounders (e.g., diet, physical activity, body composition, genetic variants) which were not available can exist. Finally, causes of death data are unavailable. |
| Njei et al., 2025 [42] | This retrospective VHA cohort study included 15,155 patients with newly diagnosed compensated MASLD-cirrhosis between January 2008 and May 2021, comprising 1,597 lean and 13,558 non-lean individuals. Associations with hepatic decompensation, MACE and all-cause mortality were assessed using multivariable Cox models, with Fine and Gray competing-risk regression where appropriate. | In this predominantly male VHA cohort (95%; median age 67 years), lean MASLD-cirrhosis was associated with lower diabetes prevalence than non-lean disease (46.7% vs. 73.9%) but higher all-cause mortality (aHR 1.64) and cardiovascular mortality (aHR 1.40), despite a lower risk of hepatic decompensation (aSHR 0.67). | Lean MASLD-cirrhosis was associated with higher all-cause and cardiovascular mortality despite lower hepatic decompensation risk, more favorable CMP, and similar MACE rates. | Restricted generalizability of the findings results from an older, predominantly male Veterans Affairs cohort, potential misclassification from routine clinical data, and residual confounding related to sarcopenia, frailty, alcohol exposure, lifestyle, medication use and cirrhosis severity. |
| Nso et al., 2024 [43] | This meta-analysis included 21 studies comparing lean (n = 7,153; mean age 52.9 years; 56% male) and non-lean MASLD (n = 23,514; mean age 53.2 years; 63% male), with pooled ORs and 95% CIs estimated for CV, mortality and metabolic outcomes. | Lean MASLD was associated with higher cardiovascular mortality than non-lean MASLD (OR 1.5, 95% CI 1.2–1.8), while CVD odds were lower by 40% and MACE did not differ materially; all-cause mortality was directionally higher, and hypertension and dyslipidemia were each 30% less frequent. | Despite a more favorable CMP and comparable MACE rates, lean MASLD is associated with increased CV mortality. | As a meta-analysis of observational studies, these findings are limited by heterogeneity in MASLD definitions, BMI cut-offs, outcome ascertainment, follow-up duration, and covariate adjustment across included cohorts. Residual confounding, publication bias, and the use of aggregate rather than individual participant data may affect the precision and causal interpretation of the pooled CV risk estimates. |
aHR: adjusted hazard ratio; aOR: adjusted odds ratio; aSHR: adjusted subdistribution hazard ratio; BMI: body mass index; CAP: controlled attenuation parameter; CBVE: cerebrovascular events; CKB: China Kadoorie Biobank; CIs: confidence intervals; CMP: cardiometabolic profile; CUN-BAE: Clínica Universidad de Navarra-Body Adiposity Estimator; CV: cardiovascular; CVD: cardiovascular disease; CVE: cardiovascular events; EHC: extrahepatic cancer; GCKR: glucokinase regulator; GRS: genetic risk score; HEI: Healthy Eating Index; HF: heart failure; HRs: hazard ratios; HCC: hepatocellular carcinoma; HOMA-IR: homeostasis model assessment of insulin resistance; LREs: liver-related events; LRM: liver-related mortality; MACE: major adverse cardiovascular events; MALO: major adverse liver outcome; MASLD: metabolic dysfunction-associated steatotic liver disease; MLM: machine learning model; NASH: nonalcoholic steatohepatitis; NFS: NAFLD fibrosis score; NHANES: National Health and Nutrition Examination Survey; SLD: steatotic liver disease; OR: odds ratio; UKB: UK Biobank; USA: United States of America; VCTE: vibration-controlled transient elastography.
Because the NAFLD, MAFLD, and MASLD frameworks are not fully interchangeable, terminology was handled conservatively. Comparative studies indicate high concordance between cohorts classified by the NAFLD and MASLD nomenclature, with broadly similar populations and disease trajectories [44–48]. Conversely, evidence indicates that while the MASLD definition extensively captures a greater number of individuals with SLD, the MAFLD nomenclature more selectively identifies those individuals at increased risk of adverse outcomes [49] as a result of its superior ability to identify liver fibrosis that enable MAFLD to better captures mortality owing to all-causes, hepatic and extrahepatic outcomes, which are strongly associated with the severity of liver fibrosis [4].
On these grounds, throughout this Review we retain the terminology used in each original study, thereby safeguarding interpretative precision and acknowledging the historical and methodological context in which the evidence was generated.
Table 1 summarizes the selected meta-analytic reviews identified with our research strategy [17–34]. Here we discuss the clinical and research Implications of lean and non-obese NAFLD.
Lean and non-obese NAFLD should be regarded as common and clinically meaningful phenotypes rather than marginal variants of obesity-related disease. Across meta-analyses, lean and non-obese NAFLD constitute a substantial component of the disease burden: in one study, 19.2% of NAFLD cases were lean, and 40.8% were non-obese [31], whereas other investigators estimated that lean NAFLD accounted for 11.3% [21] to 20.7% of NAFLD cases [29].
In the general population, lean and non-obese NAFLD prevalence is reported at 5.1% and 12.1%, respectively [31], whereas other investigators found a global lean NAFLD prevalence ranging from 4.1% [30] to 10.2% in lean populations and 15.7% in non-obese populations [32]. These estimates imply that strategies based solely on BMI or obesity status will miss a clinically important proportion of patients with hepatic steatosis and progressive liver risk.
The prevalence of lean NAFLD varies substantially across geographical regions. Rates are consistently higher in East and South Asian populations than in many Western cohorts, a pattern that probably reflects differences in visceral and ectopic fat distribution, genetic susceptibility, dietary exposures and ethnic-specific BMI thresholds for metabolic risk. In contrast, in Western populations MASLD is more tightly coupled to obesity, although lean disease remains a clinically important and potentially under-recognized phenotype [50].
The findings support a shift from an obesity-centered approach to a risk-based approach to case finding and follow-up. Lean patients with hepatic steatosis should not be reassured solely based on a normal BMI. Instead, clinical assessment should include waist circumference or other markers of visceral adiposity, blood pressure, fasting glucose or glycated hemoglobin (HbA1c), lipid profile, uric acid and non-invasive fibrosis assessment. This is particularly important because older age, abdominal adiposity, blood pressure, impaired glucose metabolism, insulin resistance, dyslipidemia, uric acid and geographic region repeatedly emerge as key correlates [28, 34].
Compared to overweight or obese NAFLD, lean or non-obese NAFLD generally shows a more favorable cardiometabolic and histological profile [19, 23, 32, 34]. Nevertheless, this phenotype is not benign. Clinically relevant outcomes persist, including NASH in 39.0%, significant fibrosis in 29.2% and cirrhosis in 3.2% [31], higher liver-related mortality [18, 20, 26], higher all-cause mortality [21, 24], incident diabetes [25] and selected gastrointestinal cancers [22]. Therefore, lean NAFLD should trigger systematic fibrosis risk stratification, longitudinal metabolic surveillance and attention to liver-related complications even when traditional cardiometabolic risk appears modest.
From a practical clinical perspective, these findings support an individualized approach to management rather than reliance on weight-based triage alone. Lifestyle intervention remains appropriate in lean NAFLD, but its goals should be framed carefully and tailored to the individual phenotype. Rather than emphasizing substantial weight loss, management may reasonably focus on modest weight reduction, where appropriate, together with improvements in diet quality, including reduced intake of fructose-rich foods and excess dietary cholesterol [51].
Resistance exercise and other strategies that preserve or increase skeletal muscle mass are also likely to be relevant, particularly when sarcopenia or excess visceral adiposity is suspected.
Lifestyle advice remains relevant, but in lean patients it should emphasize reduction of visceral adiposity, resistance exercise to address sarcopenia, dietary quality, limitation of excess fructose or alcohol exposure, and aggressive treatment of diabetes, hypertension and dyslipidemia when present. Because excess mortality and liver-related outcomes are reported despite lower rates of classical metabolic syndrome, follow-up intensity should be guided by fibrosis stage, age, diabetes risk and hepatic risk markers rather than BMI alone.
A systematic review and meta-analysis of cohorts applying consensus lean-MAFLD criteria [35] suggests that this phenotype is uncommon in the general population but clinically consequential. Lean-MAFLD affected about 2% of individuals and showed a cardiometabolic profile broadly comparable to overweight or obese MAFLD, with similar extrahepatic mortality rates. Notably, liver-related mortality was higher in lean-MAFLD, challenging assumptions that leanness confers hepatic protection. However, interpretation is constrained by substantial between-study heterogeneity, observational designs, variable ascertainment of metabolic risk and outcomes, and limited adjustment for body composition, ethnicity, lifestyle and genetic susceptibility. These limitations temper causal inference and support more standardized prospective studies.
Relevant original and meta-analytic studies on lean MASLD are summarized in Table 2 [36–43, 52–59].
Across population-based and clinical cohorts, lean MASLD emerges as a measurable but highly context-dependent phenotype rather than a discrete disease entity. In population studies, its prevalence varies with ethnicity-specific BMI thresholds, sampling frame and the modality used to detect steatosis: contemporary NHANES analyses using controlled attenuation parameter estimated lean MASLD in approximately 6.4–8.9% of U.S. adults, with higher prevalence among metabolically vulnerable lean individuals, whereas an Eastern European elastography cohort reported steatosis compatible with lean MASLD in nearly one-fifth of normal-weight participants [41]. The proportion of lean individuals among all MASLD cases is similarly variable, ranging from approximately 2.8% in long-term population cohorts to 5% in a large U.S. health-system cohort, 14.1% in a deeply phenotyped prospective cohort and 20.27% in a large TriNetX non-cirrhotic MASLD analysis, underscoring the extent to which the category is shaped by recruitment setting and BMI definition [40, 52, 55, 59].
The correlates of lean MASLD indicate that the apparently reassuring BMI label conceals substantial biological heterogeneity. Variables associated with this phenotype include central or visceral adiposity captured by weight-adjusted waist index, visceral adiposity index or Clínica Universidad de Navarra-Body Adiposity Estimator (CUN-BAE); insulin resistance and diabetes; hypertension; poorer diet quality; ageing; sarcopenia-related or frailty-related markers; biochemical surrogates of more advanced liver disease, including hypoalbuminemia, thrombocytopenia and elevated AST; and inherited susceptibility involving PNPLA3/SAMM50, GCKR and combined PNPLA3–TM6SF2–HSD17B13 genetic risk scores [37, 41, 52, 53, 55–58]. These associations shift attention from body mass to adipose-tissue distribution, metabolic dysfunction, muscle reserve and genetic predisposition as the more plausible drivers of risk.
Outcome data do not support the interpretation of lean MASLD as a benign variant. In population-based prospective cohorts, lean MASLD was associated with higher risks of liver-related events and liver-related mortality than non-lean MASLD [40]. In a large propensity-matched EHR analysis, lean MASLD was also associated with higher risks of fibrosis, cirrhosis, portal-hypertensive complications, HCC, liver transplantation and all-cause mortality [52]. These findings can be reconciled with apparently conflicting data from established cirrhosis by recognizing disease stage and cohort structure: among patients with compensated MASLD-cirrhosis, lean status was associated with lower hepatic decompensation risk than non-lean status, yet all-cause and cardiovascular mortality remained higher [42]. Likewise, biopsy-enriched data indicate that normal-weight and overweight MASLD may have comparable histological severity, with severity increasing more clearly in obesity, supporting a continuum of disease modified by body composition and metabolic context rather than a categorical lean vs. non-lean dichotomy [36].
Extrahepatic outcomes show the same dissociation between lower BMI and higher residual risk. Lean MASLD is often accompanied by fewer conventional cardiometabolic risk factors than non-lean MASLD, including lower prevalences of diabetes, hypertension and dyslipidemia in several cohorts, but this advantage does not consistently translate into better survival [42, 43]. A meta-analysis reported lower odds of prevalent cardiovascular disease and similar odds of major adverse cardiovascular events, but higher cardiovascular mortality among lean compared with non-lean MASLD; a prospective multicohort study similarly found lower incident cardiovascular disease but higher cardiovascular mortality; and a TriNetX analysis reported higher risks of heart failure, cardiovascular events, cerebrovascular events and all-cause mortality [38, 40, 43]. Cancer data are less definitive: Huo and colleagues [40] did not show a clearly higher risk of HCC or extrahepatic cancer in lean vs. non-lean MASLD, whereas EHR-based analyses suggested increased HCC risk in lean MASLD, indicating that surveillance decisions should be driven by fibrosis stage and validated cancer-risk factors rather than lean status alone [40, 52].
Collectively, the evidence argues that “lean MASLD” is an outdated nosography construct. BMI is an expedient anthropometric measure, but it poorly captures visceral and ectopic fat, sarcopenia, cardiometabolic fitness, ethnicity-specific adiposity thresholds, lifetime weight trajectories and genetic susceptibility. As a result, the lean label may falsely reassure clinicians and patients, delay recognition of advanced fibrosis or extrahepatic risk, and fragment what is better understood as a biological continuous spectrum of SLD. A more useful framework would abandon lean MASLD as a separate category and instead stratify all patients with MASLD according to fibrosis burden, metabolic dysfunction, central adiposity, body composition, cardiovascular risk and inherited predisposition [37, 40–43].
Here we critically discuss the relevant data pertaining to the pathogenesis of lean NAFLD/MAFLD/MASLD, as illustrated in Figure 1.
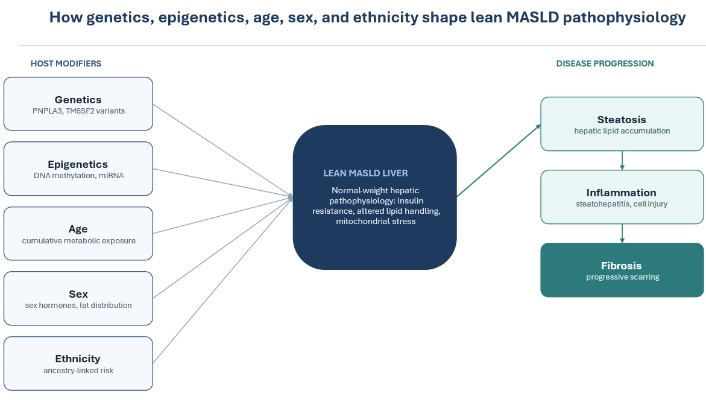
Impact of key pathogenic modifiers on lean NAFLD/MAFLD/MASLD pathophysiology. Schematic illustration of the role of age, sex, ethnicity, genetics, and epigenetics on the development and progression of steatotic liver disease owing to metabolic dysfunction among non-obese and lean individuals.
Lean MASLD is best conceptualized as a state of metabolically inefficient lipid handling in which hepatic fat accumulates despite a normal BMI. In this setting, BMI fails to capture the biologically relevant compartments that drive disease: visceral adipose tissue, ectopic lipid deposition, impaired adipose tissue expandability, reduced skeletal-muscle lipid disposal, insulin resistance, genetic predisposition and age-related changes in body composition. Thus, the apparent paradox of “lean” MASLD is largely semantic: affected individuals are often lean by total body mass but not necessarily lean in terms of visceral, hepatic or intramyocellular lipid burden [13, 16, 60, 61].
Genetic susceptibility has a proportionally larger role in lean than in obesity-associated MASLD because it can promote hepatic lipid retention without the need for generalized adiposity. Variants in PNPLA3, TM6SF2, GCKR, MBOAT7 and loss-of-function variants in HSD17B13 influence intrahepatic triglyceride remodeling, very-low-density lipoprotein export, de novo lipogenesis, inflammatory signaling and fibrosis progression. In lean MASLD, enrichment of risk alleles may therefore shift lipid storage from adipose tissue to hepatocytes and determine why some normal-weight individuals develop steatohepatitis or fibrosis while others remain metabolically healthy [34, 55, 62].
Recent MASLD-specific studies reinforce this model. In a deeply phenotyped cohort, a genetic risk score combining PNPLA3 and TM6SF2 risk alleles and the protective HSD17B13 genotype identified individuals with significant fibrosis irrespective of BMI, suggesting that inherited fibrosis susceptibility can equalize risk between lean and non-lean MASLD [55]. A Taiwan Biobank genome-wide association study identified a strong signal at the PNPLA3–SAMM50 locus in lean MASLD, replicated in an independent cohort, while a Mayo Clinic biobank analysis suggested that GCKR variation may contribute to lean MASLD among individuals with diabetes or intermediate metabolic risk [56, 57].
Epigenetic regulation offers a plausible mechanism by which early-life exposures, diet, physical activity, pollutants, alcohol below diagnostic thresholds, gut microbial metabolites and ageing modulate inherited risk. DNA methylation, histone modifications and non-coding RNAs regulate genes involved in mitochondrial function, lipid oxidation, de novo lipogenesis, inflammation and extracellular matrix remodeling. In lean MASLD, epigenetic mechanisms are particularly relevant because modest environmental or metabolic stress may be sufficient to unmask genetic susceptibility in the absence of overt obesity [63–65].
A useful framework is to regard epigenetic marks as a form of “metabolic memory”. They may preserve the hepatic consequences of prior weight gain, gestational or childhood undernutrition, insulin resistance, dietary fructose exposure or inflammatory stress even after BMI normalizes. This concept could help explain why some lean adults have hepatic steatosis, advanced fibrosis or excess mortality despite apparently favorable contemporaneous cardiometabolic profiles [18, 21, 64].
Body composition is central to the pathogenesis of lean MASLD. Low skeletal-muscle mass or function reduces the largest insulin-sensitive reservoir for postprandial glucose disposal, thereby increasing substrate delivery to the liver and amplifying hepatic de novo lipogenesis. Conversely, hepatic steatosis and systemic inflammation may worsen muscle quality, creating a bidirectional liver–muscle axis. This interaction is clinically important because sarcopenic obesity and sarcopenic leanness can both be missed by BMI-based assessment [42, 50, 66].
The concept of limited adipose-tissue expandability also helps to explain disease in normal-weight individuals. When subcutaneous adipose tissue cannot safely store excess energy, lipids are redirected to visceral depots, liver, pancreas and skeletal muscle. This “overflow” model links lean MASLD to lipotoxicity, mitochondrial stress, endoplasmic-reticulum stress, inflammasome activation and stellate-cell fibrogenesis despite a normal BMI [28, 61, 65].
Visceral adiposity is one of the most consistent mechanistic bridges between normal BMI and hepatic steatosis. Visceral fat is more lipolytically active than subcutaneous fat and drains directly to the portal circulation, thereby increasing hepatic exposure to free fatty acids, inflammatory cytokines, and adipokine imbalance. In lean adults, weight-adjusted waist index, visceral adiposity index and CUN-BAE identify metabolic risk that BMI misses, and are associated with steatosis or MASLD in NHANES and European cohorts [37, 41, 58].
Ectopic fat deposition extends this process beyond the liver. Pancreatic fat may aggravate β-cell dysfunction; skeletal-muscle lipid accumulation may impair insulin-mediated glucose uptake; and pericardial or epicardial fat may contribute to cardiovascular risk. These ectopic depots provide a plausible explanation for the observation that lean MASLD can be associated with incident diabetes, cardiovascular mortality and liver-related events despite fewer conventional metabolic-syndrome features than non-lean disease [25, 40, 43].
Age modifies lean MASLD through several converging mechanisms: progressive visceral fat accumulation, reduced mitochondrial oxidative capacity, declining skeletal-muscle mass, immune senescence, clonal haematopoiesis, altered gut barrier function and a higher prevalence of diabetes or hypertension [67]. Meta-analyses and population studies consistently identify older age as a correlate of lean or non-obese NAFLD/MASLD, and older lean patients may accumulate fibrosis or mortality risk even when obesity-related metabolic burden appears modest [29, 30, 34, 36].
Sex influences the pathogenesis of lean MASLD through differences in fat distribution, sex-hormone signaling, mitochondrial metabolism, bile-acid physiology and inflammatory tone [68, 69]. Premenopausal women generally have greater subcutaneous fat storage capacity and relative protection from visceral adiposity, whereas menopause shifts fat distribution towards visceral and ectopic depots [70, 71]. In men, lower subcutaneous expandability and greater visceral fat burden may increase hepatic substrate flux at lower BMI. Experimental data also suggest that lean steatotic phenotypes can display sexual dimorphism in liver–heart interactions, supporting sex-specific assessment of hepatic and cardiometabolic risk [43, 72].
Ethnicity is not a peripheral modifier but a core determinant of how leanness should be interpreted. Asian populations develop diabetes, visceral adiposity and MASLD at lower BMI than many European-ancestry populations, which is why lean thresholds are commonly set at BMI < 23 kg/m2 for Asian individuals and < 25 kg/m2 for non-Asian individuals [73]. Higher lean-MASLD prevalence in Asian cohorts probably reflects a combination of visceral adiposity at lower BMI, dietary patterns, early-life exposures and allele-frequency differences in variants such as PNPLA3 and TM6SF2 [14, 30, 31, 56].
Lean MASLD can therefore be modelled as the convergence of four axes: inherited susceptibility, epigenetic and environmental programming, adverse body composition, and demographic modifiers. Genetic variants determine the propensity to retain lipid and develop fibrosis [74]; epigenetic marks translate exposures into durable changes in hepatic metabolism [75]; visceral, ectopic and sarcopenic body composition provides the metabolic substrate [76]; and age, sex and ethnicity determine how these processes are expressed clinically [77, 78]. This model explains why BMI-defined leanness does not protect against MASH, fibrosis, diabetes, cardiovascular mortality or liver-related events, and why risk stratification should prioritize fibrosis, visceral adiposity, insulin resistance, muscle reserve and genetic risk over BMI alone [13, 40, 50, 55].
Although the association between adiposity and hepatic steatosis has long been recognized, captured by the observation that “fatty people have fatty livers” [1, 79], this should not be misconstrued to imply that lean individuals are exempt from developing SLD. The occurrence of NAFLD and NASH in individuals without overt obesity had already been described in 2001 by Marchesini et al. [80], who used the euglycemic clamp technique to assess insulin sensitivity in 30 patients with biopsy-proven NAFLD/NASH, normal glucose tolerance and BMI < 30 kg/m2 [80]. Irrespective of BMI, most patients exhibited central fat accumulation, atherogenic dyslipidemia and hyperuricemia, consistent with a state of systemic metabolic dysfunction and further substantiated by detailed assessment of insulin resistance [80]. Additional studies have yielded further evidence in support of genetics, epigenetics, age, sex, and ethnicity rather than obesity [16, 56, 62, 64, 81]. Over a relatively short period, the concept of lean MASLD has evolved from a phenotype characterized by less severe histological abnormalities than those observed in patients with overweight or obesity-associated NAFLD [33] to a condition now recognized as being associated with higher liver-related mortality.
The reviewed evidence also highlights several research priorities. First, studies should harmonize definitions of lean and non-obese NAFLD across ethnic groups, because BMI thresholds and body composition differ substantially between populations. Second, future cohorts should move beyond BMI and incorporate direct or surrogate measures of visceral fat, muscle mass, insulin resistance, diet, physical activity, alcohol exposure and genetic susceptibility. Such phenotyping is essential to explain why some lean individuals develop progressive fibrosis, diabetes, cancer, or excess mortality despite a comparatively favorable metabolic profile.
Third, longitudinal studies are needed to clarify natural history and causal pathways. Current meta-analyses indicate associations with liver-related mortality, all-cause mortality, incident diabetes and selected gastrointestinal cancers, but heterogeneity remains substantial. Large prospective cohorts with standardized imaging, fibrosis markers, histology where available, and adjudicated outcomes would help distinguish patients with indolent steatosis from those at high risk of progressive disease.
Finally, lean and non-obese patients should be deliberately included in clinical trials of lifestyle, pharmacological, and surveillance strategies. Excluding or under-representing these patients may limit the generalizability of trial findings and perpetuate BMI-based gaps in care. Future trials should evaluate whether treatment thresholds, lifestyle targets, fibrosis monitoring intervals and cancer surveillance approaches require adaptation for lean NAFLD phenotypes.
In conclusion, NAFLD/MAFLD/MASLD pathobiology is better understood within broader frameworks that integrate body composition, visceral and ectopic adiposity, age, sex, ethnicity, cardiometabolic risk, genetic susceptibility and clinical outcomes.
BMI: body mass index
HbA1c: glycated hemoglobin
HCC: hepatocellular carcinoma
MAFLD: metabolic dysfunction-associated fatty liver disease
MASH: metabolic dysfunction-associated steatohepatitis
MASLD: metabolic dysfunction-associated steatotic liver disease
MetALD: metabolic dysfunction and alcohol-associated liver disease
NAFLD: nonalcoholic fatty liver disease
SLD: steatotic liver disease
Microsoft Copilot was used for English polishing and creating original illustrations including graphical abstract and Figure 1. The authors have checked and revised the manuscript and take full responsibility for its content.
AL: Conceptualization, Investigation, Writing—original draft, Writing—review & editing. RW: Conceptualization, Investigation, Writing—original draft, Writing—review & editing. Both authors read and approved the submitted version.
Amedeo Lonardo, who is the Associate Editor of Exploration of Medicine, and Ralf Weiskirchen, who is the Editorial Board Member of Exploration of Medicine, had no involvement in the decision-making or the review process of this manuscript.
Not applicable.
Not applicable.
Not applicable.
Not applicable.
Not applicable.
© The Author(s) 2026.
Open Exploration maintains a neutral stance on jurisdictional claims in published institutional affiliations and maps. All opinions expressed in this article are the personal views of the author(s) and do not represent the stance of the editorial team or the publisher.
Copyright: © The Author(s) 2026. This is an Open Access article licensed under a Creative Commons Attribution 4.0 International License (https://creativecommons.org/licenses/by/4.0/), which permits unrestricted use, sharing, adaptation, distribution and reproduction in any medium or format, for any purpose, even commercially, as long as you give appropriate credit to the original author(s) and the source, provide a link to the Creative Commons license, and indicate if changes were made.



View: 95
Download: 8
Times Cited: 0


