 Original Article

Affiliation:
1Department of Pediatrics, College of Medicine and Health Sciences, United Arab Emirates University, Abu Dhabi, United Arab Emirates
ORCID: https://orcid.org/0000-0001-6258-2657
Affiliation:
2Department of Pharmacology and Therapeutics, College of Medicine and Health Sciences, United Arab Emirates University, Abu Dhabi, United Arab Emirates
ORCID: https://orcid.org/0000-0003-2383-457X
Affiliation:
1Department of Pediatrics, College of Medicine and Health Sciences, United Arab Emirates University, Abu Dhabi, United Arab Emirates
ORCID: https://orcid.org/0000-0002-8056-5014
Affiliation:
1Department of Pediatrics, College of Medicine and Health Sciences, United Arab Emirates University, Abu Dhabi, United Arab Emirates
ORCID: https://orcid.org/0000-0003-1593-0668
Affiliation:
1Department of Pediatrics, College of Medicine and Health Sciences, United Arab Emirates University, Abu Dhabi, United Arab Emirates
Email: drsrk@uaeu.ac.ae; drradhakrishnanss@gmail.com
ORCID: https://orcid.org/0000-0002-1115-1870
Explor Med. 2024;5:232–242 DOI: https://doi.org/10.37349/emed.2024.00218
Received: November 17, 2023 Accepted: January 04, 2024 Published: April 22, 2024
Academic Editor: Esma R. Isenovic, University of Belgrade, Serbia
Aim: Hypoglycemia occurs in the neonatal period but the exact pathophysiology of the resulting brain injury at the cellular level is not well known. Therefore, a neonatal murine model was developed with insulin-induced hypoglycemia, to analyze the in-vitro effects of hypoglycemia on brain nucleotides and adenylate energy charge (AEC) throughout the first ten days of life.
Methods: Newly born BALB/c pups between one and ten days of age were used. In each age group, six pups were subjected to insulin-induced hypoglycemia and six others served as controls. In both groups, immediately after euthanasia, brain tissues were collected. The in-vitro effects of hypoglycemia on brain nucleotides [adenosine monophosphate (AMP), adenosine diphosphate (ADP), and adenosine triphosphate (ATP)] were analyzed using liquid chromatography with tandem mass spectrometry (LC-MS/MS) as well on AEC.
Results: In the controls, the cellular AEC steadily decreased with age by at least 50% over the 10-day study period (P < 0.05) except in the parietal tissue (P = 0.30) where it remained stable throughout that period. The most marked decrease was observed in the occipital tissue (P < 0.001). In the hypoglycemic mice, AEC in both the parietal and occipital tissues decreased significantly more than in the controls, more rapidly and pronounced between day 2 and 5 in the occipital tissue, reaching very low levels from day 5 onward. Except in the occipital tissue, none of the adenine nucleotides on its own, including ATP, reflected the cellular AEC.
Conclusions: Over the first ten days of life, hypoglycemia progressively depleted cellular AEC in the brain, unlike cellular ATP concentration which did not appropriately reflect cellular energy.
Hypoglycemia occurs in the neonatal period, during the metabolic transition to the extrauterine environment as maternal glucose delivery to the infant ceases after birth, resulting in a fall in neonatal blood glucose levels which will later normalise. Although it is more common in preterm or growth restricted or macrosomic infants, or those born to a mother with poorly controlled diabetes, it may also occur in infants not considered to be at risk, they stabilize their blood sugar concentration by day 4 [1–4]. However, many controversies persist, including the definition of hypoglycemia, whether current screening guidelines are adequate and what devices should be used to measure and monitor blood glucose concentrations [5]. The pathophysiology of neonatal hypoglycemia remains speculative in a majority of cases [6].
The main deleterious effect of hypoglycemia is neuroglycopenia, or brain energy insufficiency occurring in the central nervous system [5, 7, 8]. This is unsurprising as 60% of the glucose available for the body is utilized by the brain as metabolic substrate required to generate adenosine triphosphate (ATP) for its normal physiologic functions. With this high energy demand, the brain needs continuous delivery of glucose. With the existing linear relationship between plasma glucose levels and brain glucose concentration, the brain can survive only for a few minutes after glucose deprivation [9]. When blood glucose concentration reaches approximately 42 mg/dL, the brain glucose level drops to zero due to its continuous consumption by brain cells.
In newborn rats, brain damage is due to recurrent hypoglycemia [10]. In humans, hypoglycemia compromises brain structure [7] and function [11, 12] and, if severe, white matter abnormalities are observed on brain magnetic resonance imaging [13]. The parietal and occipital lobes are the most commonly affected regions [7, 11, 12, 14]. The hypoglycemia-induced cerebral injury may be sub-clinical or presents as neurologic dysfunctions, such as irritability, neurological deficits, seizure, coma and, ultimately, neuronal death with permanent long-term neurodevelopmental impairment [8, 15–17]. These complications are less frequent when blood glucose concentration is maintained above 47 mg/dL [18]. Even early transient newborn hypoglycemia, thought initially to be benign, is associated with lower achievement test scores at 10 years of age [19].
The pathophysiology of hypoglycemic brain injury, the role of its severity, age of occurrence or duration are not well known. The developing brain of a newborn is exquisitely sensitive to substrate reduction since it has minimal high-energy phosphates reserves, and hypoglycemia also inhibits glycolysis and glycogenolysis, making it even more vulnerable to injury. Mitochondria generate cellular energy by recycling low energy adenosine diphosphate (ADP) to high energy ATP which is the source of energy for use and storage in the cells. A modest but nearly constant amount of intracellular ATP provides the mitochondria with regular energy input. When consumed in metabolic processes, ATP is converted either to ADP or to adenosine monophosphate (AMP).
ATP is synthesized mainly in mitochondria where the oxidative phosphorylation performs coupling between oxygen consumption and phosphorylation of ADP. However, mitochondrial fragmentation occurs within minutes of glucose starvation [20]. This results in disruption of their structure, reduction of their number by upregulating the expression of mitophagy markers, and the production of reactive oxygen species (ROS) [21]. The mitochondrial membrane potential is also impaired and its energy metabolism is suppressed resulting in impairment in mitochondrial dynamics [22]. Nonetheless, cellular ATP content is not the best representative of cellular energy status because it is, instead, the balance between the three nucleotides (ATP, ADP, and AMP) which is essential for cellular homeostasis [23]. This is better represented by the cellular adenylate energy charge, abbreviated as AEC which is expressed by the equation [ATP] + 0.5 [ADP]/[ATP] + [ADP] + [AMP] [24]. While its value varies within a scale between 0 and 1, it is preserved in a narrow range between 0.7 and 0.95 in the cells of both prokaryotes and eukaryotes [25]. The energy of the system is fully charged when all adenylate is in the form of ATP and fully discharged when only AMP is present. AMP-activated protein kinase (AMPK), a sensor of cellular energy change, is activated by increased AMP/ATP and/or ADP/ATP ratios which occur during metabolic stresses that either interfere with the generation of ATP (e.g., glucose deprivation, hypoxia, ischemia) or accelerate its consumption (e.g., muscle contraction) [26, 27]. AMPK maintains the energy balance by decreasing the ATP-consuming processes while the metabolic pathways such as glucose and fatty transport, fatty acid oxidation, autophagy, mitochondrial synthesis and oxidative metabolism are increased to preserve ATP during energy deficiency [27, 28]. Hypoglycemia causes functional brain failure due to decrease in AEC which represents brain fuel that alters brain function and behavior. Hence, it is a marker of cell failure. However, if managed early, this can be reversed by increasing plasma glucose concentrations. Nevertheless, prolonged hypoglycemia causes activation of neuronal glutamate receptors, glutamate release, production of ROS, activation of poly (ADP-ribose) polymerase, neuronal zinc release and transition in mitochondrial permeability resulting in hypoglycemia induced neuronal death. The low AEC is therefore both a marker of neuronal cell failure and also a direct cause of early and also, indirectly, of permanent neuronal dysfunction in neuroglycopenia [23].
Although the brain contains small amounts of glycogen [29], its complete oxidation would sustain basal respiration for only a very short time and it would be quickly depleted without the prior availability of external glucose. This limited glycolytic capacity of the neurons makes their energetic needs highly dependent on mitochondrial oxidative phosphorylation [30, 31]. Although the normal metabolic adaptation to extrauterine life also involves the use of ketone bodies as alternative substrates for cerebral oxidative metabolism, the newborn infant, however, has a limited ability to mobilize these nutrients [6]. Lactate is also a potential substitute substrate for energy metabolism [32], but it is insufficient to support metabolism as an alternate substrate to replace glucose [33].
Hypoglycemia is also more prevalent soon after birth and its prevalence decrease over the following days. Postnatal age influences hypoglycemia-induced neuronal injury in the rat brain and cellular respiration and ATP consumption have been shown to be lower in young pups than older mice, with this being exacerbated in the absence of glucose [34].
We, therefore, developed a neonatal murine model, with insulin-induced hypoglycemia, to analyze by liquid chromatography with tandem mass spectrometry (LC-MS/MS), the in-vitro effects of hypoglycemia on brain nucleotides (AMP, ADP, and ATP) as well on AEC, throughout the first ten days of life. The cellular AEC was considered a surrogate biomarker for the hypoglycemia-induced brain injury. The study hypothesis was that hypoglycemia-induced brain insult results from depletion of AEC and these effects vary throughout the initial ten days after birth. Our aims were to establish in the first ten days after birth, the following facts: (1) the baseline blood glucose concentration, as well as both the dose of insulin required to induce hypoglycemia and the time required to accomplish this after the initial dose, (2) the concomitant changes in AEC and adenine nucleotide levels in the brain with hypoglycemia, and (3) which of the ATP level or AEC better reflects the effects of hypoglycemia in the brain.
All experimental animal procedures were approved by Animal Ethics Committee of United Arab Emirates University (UAEU-ERA_2016_4247) and are in accordance with the ARRIVE guidelines.
BALB/c mice were procured and acclimatized for a week in the animal house at College of Medicine & Health Sciences, United Arab Emirates University. Each breeding cage consisted of 1 healthy male (10 weeks old and 25–28 g weight) and 2 healthy female mice (7–8 weeks old and 20–23 g weight). The animals were housed under standard room conditions of temperature, humidity and light and dark cycles (16 h light and 8 h dark cycle). The animals had free access to commercially available rodent food and water. Pups along with mothers were maintained in separate breeding cages for collecting neonatal BALB/c pups at five different age groups (day 1, 2, 5, 7, and 10). As human and mice ages are not equivalent and, based on published studies that had established the relation in age between both species, the ages that we had selected for mice correspond to a human age of 1.3, 2.6, 6.6, 9.2 and 13.2 months respectively [35]. For each of the five age groups, six pups served as controls and hypoglycemia was induced in another six, bringing the total pups in the study number of to 60. We ruled out the effect of litter size by pooling pups (6 from one litter and 6 from other litter) and divided them into control and experimental group. Animals across the different ages were sacrificed between 10–11 AM on the respective days. Before the experiment, the pups were separated from mother and transferred to new cage and they were followed by insulin administration and glucose measurement.
Each pup, in both the control and the hypoglycemia group, had blood glucose measured immediately before sacrifice, with the intent to establish the physiological variation in blood glucose concentration during the first 10 days after birth. Blood was collected by cutting the tip of the tail (≤ 1 mm) with a scalpel blade. A sample of 10 ± 5 µL of blood was obtained for each measurement and blood glucose was measured with a hand-held blood glucose meter (ONE TOUCH® Ultra®2 blood glucose meter with the stripes of code no.25 from LifeScan, Switzerland). Silver nitrate was applied to the lesion site to help in wound closure.
The control group received subcutaneous normal saline injection. The treatment group pups received insulin (0.75 IU/kg, subcutaneous, Actrapid® 100 IU/mL, Novo Nordisk, Denmark). Blood glucose levels were measured every 5 minutes. The insulin dosage was increased by increments of 0.5 U/kg until hypoglycemia was documented (blood glucose < 50 mg/dL or 2.8 mmol/L). Following blood collection, silver nitrate was applied to the lesion site to help in wound closure. A scalpel blade was used to scrape off the scab and the tail was massaged to withdraw blood in subsequent blood collections.
We documented the final insulin dose required to induce hypoglycemia and the time required for hypoglycemia to occur after the first insulin injection. In a pilot study in control animals, the blood glucose levels were measured at the same time as in the hypoglycemic pups, and their glucose did not vary much with the increased handling and blood sampling frequency.
Once hypoglycemia was observed, the pups were then euthanized by pentobarbital injection followed by cervical dislocation. Brain tissues were immediately collected and snap-frozen in liquid nitrogen and stored in –80°C in a deep freezer for further analysis. The same method was applied to control pups of the same age. Twenty-five milligrams of snap-frozen brain tissues (parietal/occipital) were homogenized using IKA Werke Ultra Turrax T25 Basic S1 Homogenizer Disperser 24k RPM (Germany) homogenizer in a glass tube and 30 μL of 13 C 10 ATP internal standard, and 500 μL of 0.4 mol/L HClO4 (PCA) containing 0.5 mmol/L EDTA were added to it. The homogenates were vigorously vortexed for 3 minutes at room temperature. The vortexed samples were kept on ice for 10 minutes followed by centrifugation at 14,000 g for 10 minutes at 4°C to separate the supernatant. The resulting supernatant was neutralized with 135 μL of 0.5 mol/L K2CO3 and the precipitate was removed by centrifugation at 14,000 g for 30 minutes at 4°C. Neutralized supernatants were immediately used for LC-MS/MS analyses.
Our laboratory developed the LC-MS/MS instrumentation method, slightly modifying an already established method [36]. The details are described in Supplementary material. The adenine nucleotides measurements were expressed in µg/mL, and the cellular energy charge was expressed on a continuous scale between zero and one.
The mean insulin dose that induced hypoglycemia in each age group and the time required to achieve it were calculated. Concentrations of continuous variables were expressed as mean ± standard deviation (SD) when they followed a normal distribution (Shapiro Wilk test), and with standard errors of the means in the figures. They were compared between two groups with the unpaired t-test and with analysis of variance when amongst three groups or more. Interaction, or effect modifier, between postnatal age and hypoglycemia, was tested with a two-way factorial ANOVA analysis. All statistical analyses were performed with the Stata 16.1 package (StataCorp, Texas, USA), and a two-tailed P value < 0.05 defined statistical significance.
Both the weight and the baseline blood glucose level of all 60 pups, before sacrifice, progressively increased with postnatal age (Table S1 and Figure S1).
In the hypoglycemia group, the time to develop hypoglycemia after the first insulin administration increased with postnatal age, from 15 minutes in the first five days to 20 minutes from day 7 onward. The corresponding required insulin doses increased with age from 1.75 IU/kg on day 1 to 2.25 IU/kg on day 10. Similarly, the number of required insulin injections increased from two in the first 5 days to three from day 7 onward (Table S1 and Figure S2). In the insulin-treated group, the blood glucose concentrations progressively decreased with the repeated insulin doses required to induce hypoglycemia (Table S1).
In the controls, the cellular AEC steadily decreased with age over the 10-day study period (P < 0.05) except in the parietal tissue (P = 0.30) where it remained stable throughout that period (Table S2, and Figure 1). The most marked decrease was observed in the occipital tissue (P < 0.001).
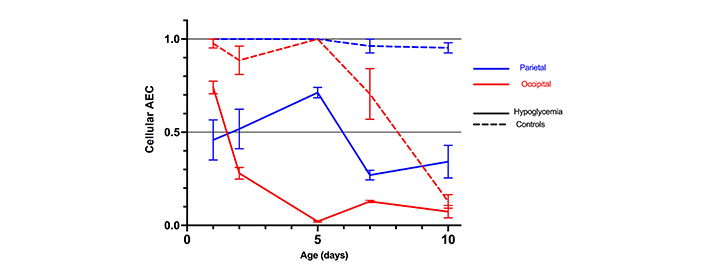
Mean cellular AEC with standard errors in the parietal and occipital tissue of 30 mice with hypoglycemia and 30 controls in the first 10 days of life
In the hypoglycemic mice, AEC in both the parietal and occipital tissues decreased significantly more than in the controls, more rapidly and pronounced between day 2 and 5 in the occipital tissue, reaching very low levels from day 5 onward (Table S2, and Figure 1).
Although the observed decrease in AEC was linked to both hypoglycemia and postnatal age, there was substantial interaction (effect modifier) between age, hypoglycemia, and AEC.
This was more marked in the occipital regions, where the hypoglycemic effect of insulin was more marked in the first five days after birth than later (Table S2 and Figure 2).

The interaction between mean cellular AEC and age in the parietal and occipital tissues of mice with hypoglycemia and control in the first 10 days of life. (A) Parietal—interaction between mean cellular AEC with confidence intervals (CIs) and age in the parietal tissue of 30 mice with hypoglycemia and 30 controls in the first 10 days of life; (B) occipital—interaction between mean cellular AEC with CIs and age in the occipital tissue of 30 mice with hypoglycemia and 30 controls in the first 10 days of life
Comparison of the variations of AEC with the adenine nucleotides concentration at different postnatal ages, in both the controls and the hypoglycemic pups, demonstrated that none of the nucleotides on its own, including ATP, reflected AEC except in the occipital tissue where the ATP level closely mirrored AEC from day 1 to day 10 (Table S2, Figure 3).
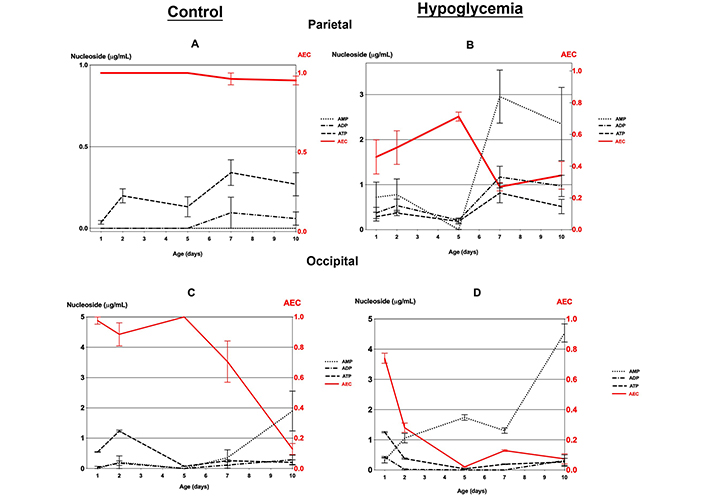
Mean cellular AEC and adenine nucleotides (AMP, ADP, and ATP) concentrations (with standard errors) in the parietal and occipital tissue of 30 mice with hypoglycemia and 30 controls in the first 10 days of life. (A) Parietal and (C) occipital tissue of controls; (B) parietal and (D) occipital tissue of mice with hypoglycemia
The parietal tissue in controls demonstrated an identical AEC of around 1.0, in all age groups. In contrast, the hypoglycemic pups showed, after day 2, a comparatively lower level of AEC < 0.7, with the adenylate pool consisting of a mixture of ATP, ADP, and especially AMP with levels comparatively higher than in the controls (Table S2, Figure 3A and B).
The occipital tissue in the controls had an AEC of 0.9 to 1.0 in the first five days when the adenylate pool consisted mainly of ATP (Figure S2, and Figure 3C). The cellular energy charge decreases rapidly to a very low level of 0.1 by day 10 with an adenylate pool consisting mainly of AMP (Figure 3C). On the other hand, the hypoglycemic group had an initial AEC value of approximately 0.74 on day 1, which subsequently declined to below 0.4 as each day progressed. The adenylate pool primarily comprised AMP. On day 10, the hypoglycemic group showed a significantly higher AMP level than in the controls (Table S2, and Figure 3D).
Our results confirm that, physiologically, blood glucose levels are low soon after birth and increase progressively in the first week of life. Furthermore, with increasing age of the pups, the development of hypoglycemia required a higher number of successive insulin injections and a higher final insulin dose. We have also established that hypoglycemia causes significant reduction in the cellular AEC by at least 50% in the occipital and parietal lobes resulting in cellular energy failure. None of the adenosine nucleotides accurately reflected cellular energy except in the occipital tissue where the ATP level closely mirrored the cellular AEC from day 1 to day 10.
These findings are consistent with recent reports demonstrating decreased cellular respiration and ATP consumption in the brain of younger mice pups [34]. The decrease in AEC that we demonstrated in parietal and occipital tissues is in keeping with the predominance of parietal and occipital lobes injury demonstrated by imaging in neonatal hypoglycemia [7]. As the glucose content in the brain is directly regulated by blood glucose levels, already low physiologically in the neonatal period, the administration of insulin will lead directly to a further decrease in brain glucose content, resulting in reduction in brain AEC. Mitochondrial respiration, the principal source of energy in the neurons, produces ATP. Insulin-induced hypoglycemia decreases mitochondrial respiratory chain efficiency. Furthermore, it has been demonstrated that recurrent hypoglycemia changes the ratio of mitochondrial respiratory chain complex I subunits, which also increases free radical production and cell death [37]. It is therefore likely that the extensive loss of AEC in hypoglycemic pups, in both the parietal and occipital tissues is caused by acute neuronal decompensation with extensive deterioration of cellular energy status caused by hypoglycemia.
In the parietal tissue, the high AEC of 1.0 remained constant over 10 days in the controls, reflecting the absence of energy loss, with the adenylate pool consisting only of ATP. In contrast, the hypoglycemic pups showed lower level of cellular AEC, indicating the presence of ATP, ADP, and AMP, with a comparatively higher or equal level of AMP, reflecting the underlying metabolic stress caused by hypoglycemia [28, 38].
In the occipital tissue, the initially high AEC of 0.7 to 1.0 in the first 5 days in the controls, with the adenylate pool consisting mainly of ATP, indicates, therefore, the absence of metabolic stress. In contrast, the AEC quickly decreased to very low levels in the hypoglycemic group in close parallel to ATP, with an adenylate pool consisting mainly of AMP and ADP, explained by the underlying metabolic stress caused by hypoglycemia [28, 38]. The reason for the vulnerability of the occipital lobe to hypoglycemia remains unclear. Positron emission tomography has demonstrated that glucose demand in neonatal visual areas is relatively low. Perhaps the thicker the fourth lamina of the visual cortex is thicker with more neurons and synapses, thus requiring more glucose. Furthermore, the proliferating occipital axonal growth and synaptogenesis in the neonatal period require more glucose as substrate. However, as the occipital lobes are supplied with blood (and glucose) from the posterior cerebral artery, their demands are in direct competition with the other metabolically active areas such as the brainstem, cerebellum and part of the thalamus which share the same blood supply [39]. The high rate of energy loss between day 2 and 7, more in the occipital tissue and in hypoglycemic pups, probably results from decreased glucose utilization secondary to reduced blood glucose supply. Another reason for the very low occipital AEC at day 10 might be the rapid maturation of the occipital lobe, with migrating visual fibres that are very sensitive to changes in glucose concentrations.
The strength of this study includes the use of LC-MS/MS as a novel tool to study not only the brain cells nucleotide concentrations in hypoglycemia but, more importantly, the changes in their cellular AEC.
Our study has some limitations. We only studied a limited number of brain zones, focusing on the parietal and occipital lobes as they are the most commonly affected by hypoglycemia [7]. We acknowledge that our model of insulin-induced hypoglycemia does not replicate the pathophysiology of neonatal hypoglycemia where insulin is not usually the cause. As the administered insulin promotes glycogen storage and inhibits glycogenolysis, the prevalent ketogenesis in neonatal rodents, would also be suppressed as insulin suppresses lipolysis. Thus, the insulin-induced hypoglycemia cannot be explained only by decreases in circulating glucose as we have not measured nor controlled for the alternative cerebral fuels such as lactate and ketones [6, 33]. Moreover, we did not control for the effect of pup sex, weight or litter size. The reasons include that sex determination is only possible between 3–4 weeks of age, by measuring the anogenital distance (AGD), which cannot be reliably quantified in mice pups. Similarly, the visualization of the abdominal (inguinal) teats in females cannot be made before day eight. Moreover, we did not use sex determination by polymerase chain reaction (PCR) methods. However, the birth weight of pups was in narrow range and, therefore unlikely to cause significant variation in the results and also the effect of litter size has been ruled out by pooling pups of the same age (six from one litter and six from other litter) and dividing them between the two groups. In addition, instead of laboratory measurements, blood glucose levels were measured using ONE TOUCH® Ultra®2 blood glucose meter, which has been already used in previous research projects in mice where the obtained results correlated well with venous blood measurements, even at low glucose concentrations. Moreover, we aimed to replicate the diagnosis of hypoglycemia in neonates at risk where this is performed by serial capillary blood glucose measurement by handheld glucometers. We selected a serum level < 50 mg/dL or < 2.8 mmol/L as a threshold for detecting hypoglycemia in mice based on previous studies which used < 3.0 mmol/L [40]. In the insulin-treated group, the blood glucose concentrations progressively decreased with the repeated insulin doses required to induce hypoglycemia, making it impossible to ascertain if this decrease was only caused by insulin or was also compounded by the number of times that the animals had to be handled for the repeated injections. However, as this effect was also observed in controls to varied degree, we believe the latter hypothesis to be unlikely. Furthermore, as we only examined the parietal and occipital areas of the brain, other parts might have shown different results. Additionally, we did not measure glycogen or ketones to study their effect on cell metabolism during hypoglycemia [6]. Although we clearly recognize that insulin-induced hypoglycemia may not necessarily reflect the underlying mechanism of neonatal hypoglycemia, using instead fasting in neonatal pups would have been unethical.
The model we used can be useful for more research in this field. Further studies should include a comparison with other high energy-consuming organs such as skeletal muscle, heart, and kidneys, in addition to other high energy-consuming parts of the brain such as the hypothalamus, hippocampus, basal ganglia and striatum. The effect of measuring other substrates, such as ketones, is also needed. Measurement of apoptotic and mitochondrial markers in brain tissue following hypoglycemia, with histopathological analysis, are also needed to increase our understanding of the mechanisms of hypoglycemia at the molecular level.
During the first ten days of life, hypoglycemia depletes cellular adenylate energy (AEC) in the brain, unlike cellular ATP concentration which did not appropriately reflect in cellular energy. We believe that the cellular AEC should replace ATP concentrations in future studies on the impact of biological or therapeutic factors on cellular energy.
ADP: adenosine diphosphate
AEC: adenylate energy charge
AMP: adenosine monophosphate
ATP: adenosine triphosphate
LC-MS/MS: liquid chromatography with tandem mass spectrometry
The supplementary materials for this article are available at: https://www.explorationpub.com/uploads/Article/file/1001218_sup_1.pdf
We are grateful to Professor Abdu Adem for facilitating the use of the central facilities of the Pharmacology Department, College of Medical and Health Science, United Arab Emirates University, Abu Dhabi, United Arab Emirates.
HN: Investigation, Supervision, Funding acquisition, Methodology, Data curation, Writing—original draft, Writing—review & editing. PY: Methodology, Data curation, Software, Validation, Writing—review & editing. JAG and RLJ: Resources, Methodology. RS: Investigation, Project administration, Methodology, Formal analysis, Data curation, Writing—original draft, Writing—review & editing.
The authors declare no conflicts of interest.
All experimental animal procedures were approved by Animal Ethics Committee of United Arab Emirates University (UAEU-ERA_2016_4247) and are in accordance with the ARRIVE guidelines.
Not applicable.
Not applicable.
The datasets that support the findings of this study are available from the corresponding author upon reasonable request.
This work was funded by a research grant from the Sheikh Hamdan Bin Rashid Al Maktoum Award for Medical Sciences [MRG-66/2015-2016]. The funders had no role in study design, data collection and analysis, decision to publish, or preparation of the manuscript.
© The Author(s) 2024.
Copyright: © The Author(s) 2024. This is an Open Access article licensed under a Creative Commons Attribution 4.0 International License (https://creativecommons.org/licenses/by/4.0/), which permits unrestricted use, sharing, adaptation, distribution and reproduction in any medium or format, for any purpose, even commercially, as long as you give appropriate credit to the original author(s) and the source, provide a link to the Creative Commons license, and indicate if changes were made.

View: 3702
Download: 35
Times Cited: 0
