Original Article

Affiliation:
1Department of Pediatric Cardiology, Max Super Specialty Hospital, New Delhi 110017, India
2Department of Pediatrics, Nepal Medical College Teaching Hospital, Kathmandu 44600, Nepal
3Philanthropy Nepal (Paropakari Nepal) Research Collaboration, Auburn 2144, Australia
ORCID: https://orcid.org/0000-0003-4177-7679
Affiliation:
1Department of Pediatric Cardiology, Max Super Specialty Hospital, New Delhi 110017, India
Affiliation:
3Philanthropy Nepal (Paropakari Nepal) Research Collaboration, Auburn 2144, Australia
4Translational Health Research Institute, Western Sydney University, Campbelltown 2560, Australia
ORCID: https://orcid.org/0000-0002-9118-7805
Affiliation:
3Philanthropy Nepal (Paropakari Nepal) Research Collaboration, Auburn 2144, Australia
5School of Medicine, Western Sydney University, Campbelltown 2560, Australia
ORCID: https://orcid.org/0000-0003-1121-2829
Affiliation:
6Department of Radiology, Max Super Specialty Hospital, New Delhi 110017, India
Affiliation:
7Department of Neonatal and Congenital Heart Surgery, Max Super Specialty Hospital, New Delhi 110017, India
Affiliation:
1Department of Pediatric Cardiology, Max Super Specialty Hospital, New Delhi 110017, India
Email: n_awasthy@yahoo.com
ORCID: https://orcid.org/0000-0001-6019-4693
Explor Med. 2024;5:112–126 DOI: https://doi.org/10.37349/emed.2024.00210
Received: September 07, 2023 Accepted: January 02, 2024 Published: February 29, 2024
Academic Editor: Guo-Chang Fan, University of Cincinnati College of Medicine, USA
Aim: This study aimed to evaluate the role of chest radiographs and electrocardiograms in predicting the hemodynamics of congenital heart disease (CHD).
Methods: This retrospective study included 50 patients with a diagnosis of CHD who had undergone any form of cardiac intervention, either surgical or nonsurgical between September 2019 and September 2020. Chest radiographs and electrocardiograms were evaluated and compared with the diagnostic gold standard echocardiography.
Results: Chest radiographs had the highest sensitivity, specificity, and accuracy, with all being 100%, in detecting situs and cardiac position. There was a very good agreement between chest radiographs and echocardiography in the detection of both situs and cardiac position (κ = 1.00, P < 0.001), while moderate agreement was observed for the detection of cardiomegaly, position of the aortic knuckle, main pulmonary artery dilation, and right pulmonary artery dilation. Electrocardiograms had a high sensitivity (100.00%), but modest specificity and accuracy for the detection of left ventricle pressure overload. For the detection of left atrial enlargement and left ventricle volume overload, electrocardiograms had high specificity (94.12% and 94.29%, respectively) but low sensitivity and modest accuracy. There was a moderate agreement between electrocardiograms and echocardiography in the detection of right ventricle pressure overload (κ = 0.43, P = 0.002) and left ventricle volume overload (κ = 0.46, P < 0.001).
Conclusions: The study findings indicate that chest radiographs and electrocardiograms alone are not adequate for the assessment of hemodynamics of CHD and reinstates the recommendation that in addition to routine chest radiographs and electrocardiograms, echocardiography should be performed.
Congenital heart disease (CHD) remains the most common birth defect, affecting approximately 0.8% to 1.2% of live births across the globe [1]. There has been an increasing birth prevalence of CHD last decade, with a rise from 4.55 per thousand in 1970–1974 to 9.41 per thousand in 2010–2017 [2]. CHD is characterized by a structural abnormality of the heart and/or great vessels that is present at birth [2]. Almost one-third of all major congenital anomalies consist of heart defects [3], and CHD malformations can occur as single lesions or in combination with other heart defects [4]. Isolated or single lesions include atrial septal defects, ventricular septal defects, and pulmonary stenosis; complex or combination lesions include atrioventricular septal defects, tetralogy of Fallot, and transposition of the great arteries (TGA) [4, 5]. In 2017, atrial septal defects and ventricular septal defects were reported as the most common subtype of CHD, accounting for almost 30% of all cases of CHD [1]. With only about 15% of CHD cases being attributable to a known cause [4], it presents a significant challenge in developing countries, where both the incidence and mortality rates of CHD have been rising [1]. Therefore, early detection and diagnosis as well as timely interventions are critical to reducing morbidity and mortality [5].
However, the diagnosis of CHD is challenging especially among children due to the numerous clinical signs including, dyspnea, cough, and failure to thrive, which can be misinterpreted as symptoms of other illnesses until the diagnosis of CHD is confirmed [6]. Taking a thorough medical history and performing a physical examination remain integral aspects of diagnosing CHD. Despite asymptomatic and normal physical examination, many children are diagnosed with CHD necessitating the use of other diagnostic modalities for early detection and intervention as clinically required in these subsets [7].
Clinical assessment along with chest radiographs and electrocardiograms remain the core of evaluating children with suspected CHD [8]. However, due to the advent of advanced imaging technologies such as echocardiography, computed tomography (CT), and magnetic resonance imaging (MRI), chest radiographs and electrocardiograms have become traditional approaches [9]. Especially with echocardiography being considered as the primary diagnostic tool, the utility of these imaging modalities for the preliminary diagnosis of CHD is in a decreasing trend. Despite advanced imaging options, chest radiographs and electrocardiograms remain the most accessible and cost-effective techniques for the initial assessment of suspected CHD. Especially in developing countries, these imaging modalities can still be valuable tools for the detection of CHD.
The effectiveness of advanced imaging modalities including echocardiography, CT, and MRI in the diagnosis and management of CHD is well-established [9]. Advanced computer and medical imaging technologies are often employed to obtain the local hemodynamics of the investigated site and illustrate the hemodynamic characteristics [10]. However, there is a paucity of studies demonstrating the significance of chest radiographs and electrocardiograms in the detection of CHD. A prior study conducted in the United States demonstrated the advantages of chest radiographs and electrocardiograms in diagnosing certain cardiac defects precisely and emphasized that these diagnostic tools should be retained as a part of the routine evaluation of CHD [8]. Another study conducted in Egypt examined the value of chest radiographs and electrocardiograms in the evaluation of patients with heart murmurs in the presence of echocardiography [11]. Nonetheless, to the best of our knowledge, there is no single study that demonstrates the role of these diagnostic tools for the assessment of the hemodynamics of CHD.
The study aimed to evaluate the role of chest radiographs and electrocardiograms in predicting the hemodynamics of CHD, taking echocardiography as the diagnostic standard.
This was a retrospective study carried out in the Department of Pediatric Cardiology at Max Super Specialty Hospital in New Delhi, India. Ethics approval was attained from the Institutional Ethics Committee, Devki Devi Foundation (Reference No: RS/MSSH/DDF/SKT-2/IEC/PED-CARDIO/20-44), prior to study commencement. All patients with a diagnosis of CHD who had undergone any form of cardiac intervention, either surgical or nonsurgical between September 2019 and September 2020, were included in this study. The CHD included in this study are outlined in Table 1. However, those patients who had not undergone any cardiac intervention, either invasive or noninvasive, and were managed medically were excluded.
CHD included in this study
| Categorization of CHD | Description |
|---|---|
| Acyanotic lesions | Left to right shunts (atrial septal defect, ventricular septal defect, patent ductus arteriosus, atrioventricular septal defect) |
| Obstructive lesions (pulmonary stenosis, aortic stenosis, coarctation of aorta) | |
| Cyanotic lesions | Pulmonary stenosis with right to left shunt at atrial level (critical pulmonary stenosis, Ebstein anomaly, pulmonary atresia with intact ventricular septum) |
| Pulmonary stenosis with ventricular septal defect (tetralogy of Fallot, double outlet right ventricle with pulmonary stenosis, transposition of great arteries with pulmonary stenosis, single ventricle with pulmonary stenosis, ventricular septal defect with pulmonary stenosis, congenitally corrected TGA with pulmonary stenosis, complete atrioventricular canal defect with pulmonary stenosis, pulmonary atresia with ventricular septal defect) | |
| Transposition of great arteries physiology (d-TGA, DORV, tricuspid atresia, single ventricle, total anomalous pulmonary venous return) | |
| Decreased pulmonary blood flow with pulmonary arterial hypertension (pulmonary venous hypertension, hypoplastic left heart syndrome, TAPVC with obstruction) | |
| Pulmonary venous hypertension (Eisenmenger syndrome) | |
| Others | Including mitral regurgitation, left atrial myxoma |
DORV: double outlet right ventricle; d-TGA: dextro-TGA; TAPVC: total anomalous pulmonary venous return
All data were collected pre-operatively or pre-intervention, and data collection was conducted in a pre-designed and pre-tested proforma. All three tests (i.e., chest radiographs, electrocardiograms, and echocardiography) were conducted on the same day for each patient. The evaluation of chest radiographs, electrocardiograms, and echocardiography was performed within three days of the initial assessment. The chest radiographs and electrocardiograms were evaluated by three pediatric cardiologists, of which two were blinded about the diagnosis, and the results were compared with the final diagnosis of echocardiography. Similarly, echocardiography was conducted by an experienced pediatric cardiologist, and the images were cross-verified by two pediatricians who were blinded about the diagnosis.
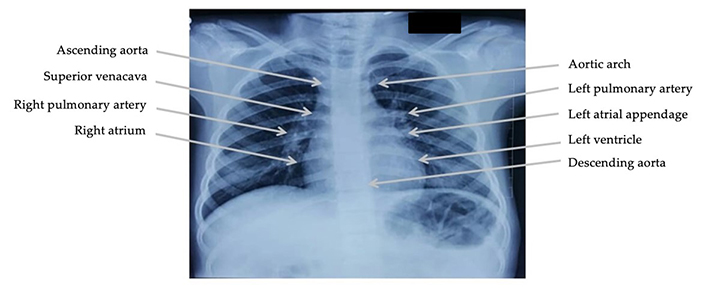
Chest radiographs in anterior-posterior, posterior-anterior, and lateral view were evaluated for the following parameters, namely situs, cardiac position, thymic shadow, cardiomegaly, right atrium enlargement, left atrium enlargement, right ventricle enlargement, left ventricle enlargement, position of the aortic knuckle, ascending aorta dilatation, descending aorta dilatation, main pulmonary artery dilatation, right pulmonary artery dilatation, and left pulmonary artery dilatation (Figure 1). Similarly, radiographic features for pulmonary plethora, pulmonary oligemia, pulmonary arterial hypertension, and pulmonary venous hypertension were evaluated. The criteria used for chest radiographs were as per the standard guidelines [12].
The 12 lead electrocardiograms were evaluated for sinus rhythm, rate, P-axis, QRS axis, PR interval, QTc interval, QRS duration, right atrial enlargement, left atrial enlargement, bundle branch block, and biventricular hypertrophy as per standard guidelines [13]. Electrocardiogram features for volume overload and pressure overload of the right and left ventricles were evaluated.
The findings of chest radiographs and electrocardiograms were compared with the findings of echocardiography, taking this tool as the diagnostic standard. The findings from echocardiography were validated using standardized recommendations. The echocardiographic parameters were taken using cardiac Z score as the reference values for the pediatric population [14]. The study by Kampmann et al. [14] was referred for M mode measurements, and the article by Pettersen et al. [15] was referred to for other variables such as mitral valve, left ventricle, aortic valve, aortic arch, pulmonary valve, and pulmonary arteries. Moreover, the pediatric echocardiography quantification criteria were taken from the article by Lopez et al. [16]. The detailed criteria used for chest radiographs, electrocardiograms, and echocardiography in this study are summarized in Tables 2, 3, and 4, respectively.
Criteria used for chest radiographs, which was applicable to any one of the views—anterior-posterior, posterior-anterior, or lateral
| Chest radiograph measures | Criteria | |
|---|---|---|
| Rotation | The medial ends of both clavicles should be equidistant from the spinous process of the vertebral body projected between the clavicles | |
| Degree of inspiration | Adequate inspiratory effort | Five to seven complete anterior or ten posterior ribs are visible |
| Poor inspiratory effort | Fewer than five anterior ribs | |
| Hyperinflated lung | More than seven anterior ribs | |
| Penetration of the film | Normal exposure | The first four vertebral bodies are visible |
| Underexposure | The vertebral bodies are not visible | |
| Overexposure | The film appears too ‘black’ and vertebral bodies are visible beyond the first four vertebral bodies | |
| Situs | Situs solitus | Liver and inferior vena cava on right side and fundus of stomach on left side Morphological right atrium lies on the right side and opposite the fundus of stomach Right-sided bronchus is shorter, wider, and more vertically oriented than left-sided bronchus |
| Situs inversus | Liver and inferior vena cava on left side and fundus of stomach on right side Left-sided bronchus is shorter, wider, and more vertically oriented than right-sided bronchus | |
| Isomerism | Right isomerism: liver with two right lobes, malrotation of bowel bilateral morphological right trilobed lungs Left isomerism: polysplenia bilateral morphological left bilobed lungs | |
| Position | Levocardia | Left-sided position of heart and cardiac apex directed leftward, anteriorly, and inferiorly |
| Dextrocardia | Right-sided position of heart and cardiac apex directed rightward | |
| Mesocardia | Midline position of heart with two apices directed anteriorly and inferiorly | |
| Thymic shadow | Assessed in frontal radiographs as widening of superior mediastinum. Thymic sail sign can be seen as a triangular extension of normal thymus laterally. The right lobe of thymus has a convex lateral margin and a straight inferior border gets demarcated by the minor fissure which gives the sail-like appearance. The anterior reflections of the ribs produce a wavy contour of the thymus known as the thymus wave sign. The inferior margin of the thymus merges with the margin of cardiac silhouette producing the notch sign | |
| Cardiomegaly | Presence and absence of cardiomegaly are determined by calculating the cardiothoracic ratio Cardiothoracic ratio = (A + B) – C, where A and B are maximal cardiac dimensions to right and left of midline respectively and C is the widest internal diameter of the chest Presence of cardiomegaly is suspected if the cardiothoracic ratio in neonates is > 60%, in infants is > 55% and in children is > 50% | |
| Right atrium enlargement | Increase in height (distance between the top of aortic arch and junction of superior vena cava and right atrium is less than right atrium and right cardio phrenic angle) Convexity of right cardiac border > 3 cm beyond right lateral vertebral border Right cardiac border > 4.5 cm from anatomic midline | |
| Left atrium enlargement | Lifting of left main bronchus Widening of carinal angle to right or obtuse angle and carinal angle > 90 degree Double density sign-chamber large enough to produce an oval-shaped, localized density on the right side and projecting outside the lower cardiac border | |
| Left ventricle enlargement | Left and downward apex Hypertrophy causes rounding of the cardiac apex Dilatation causes elongation either to left or left and downwards often combined with rounding of apex | |
| Right ventricle enlargement | Elevation of apex Pulmonary conus becomes prominent Aortic knuckle less prominent Filling of retrosternal space in the upper part in lateral view | |
| Position of aortic knuckle | Determined as indentation in bronchus either on left or right side | |
| Ascending aorta dilatation | Assessed by enlargement of the ascending aorta which is seen as an increase in low-density almost straight edge at right upper mediastinum | |
| Descending aorta dilatation | Assessed by enlargement of the descending aorta which is seen as an increase in low-density straight line at left side | |
| Main pulmonary artery dilatation | Determined by convex enlargement of pulmonary artery segment The other method is to draw a tangent line from apex of ventricle to the aortic knob and measure along a perpendicular to tangent line. The distance between tangent line and pulmonary artery should fall between 0–15 mm away from tangent line | |
| Right pulmonary artery dilatation | Assessed by enlargement of right pulmonary artery | |
| Left pulmonary artery dilatation | Assessed by enlargement of left pulmonary artery | |
| Pulmonary plethora | Presence of more than 5 vessels in the lungs or more than 3 in one lung Presence of end on vessels more than two times the diameter of accompanying bronchus En face vessels below the tenth posterior ribs Prominent upper and lower zone vessels Prominent hilar vessels on lateral view | |
| Pulmonary oligemia | Concave or absent main pulmonary artery Less than three vessels in the peripheral one-third of the lungs Small hilar, lobar, and segmental vessels | |
| Pulmonary arterial hypertension | Pruning of pulmonary arteries (> 50% loss of vessel diameter at any degree branching) RPDA diameter is more than that of trachea in children, RPDA > 16 mm in males, RPDA > 17 mm in females Calcification of main pulmonary artery and proximal branches | |
| Pulmonary venous congestion | Stage 1: redistribution or cephalization of blood flow (13–19 mmHg) | Constriction Blurring of lower zone vessels Effacement of hilar angle Dilatation of upper lobe vessel Cuffing of fluid around small bronchioles |
| Stage 2: interstitial oedema (20–24 mmHg) | Kerley lines Peribronchial cuffing Septal and interstitial oedema Pleural effusion | |
| Stage 3: alveolar oedema (> 25 mmHg) | Bat wings appearance Pleural effusion | |
RPDA: right posterior descending artery
Criteria used for electrocardiograms, which was applicable to 12 lead electrocardiograms with standard gain (10 mm/mV)
| Electrocardiogram measures | Criteria | |
|---|---|---|
| Sinus rhythm | Determined by P waves preceding each QRS complex and P waves upright in leads I, II, and aVF | |
| Rate | Determined by measuring the RR interval Heart rate is calculated by dividing 60,000 by measured cycle length in ms | |
| P-axis | Mean frontal P wave axis is 60 degrees | |
| QRS axis | Normal axis | Lead I positive and Lead aVF positive |
| Right axis deviation | Lead I negative and lead aVF positive | |
| Left axis deviation | Lead I positive and lead aVF negative | |
| Northwest axis | Lead I negative and lead aVF negative | |
| PR interval | Measured in lead II Measured from the onset of P wave to the Q wave or R wave if no Q wave is present Normal values: 80–110 ms in neonates and infants and 120–200 ms in adolescents | |
| QTc interval | Measured in lead II and calculated by Bazett’s formula QTc = QT interval divided by the square root of the preceding RR interval QTc is prolonged if > 460 ms in females and > 450 ms in males QTc is decreased if < 380 ms | |
| QRS duration | Measured from the beginning of Q wave to the end of S wave Normal values: upper limit is 120 ms | |
| Right atrial enlargement | Frontal plane | Axis: P wave axis shifter to right of + 60 degree; P waves tall and peaked measuring > 2.5 mm in leads II, III, or aVF; and P3 > P1 Contour: P wave peaked and pointed Amplitude: height of P wave > 2.5 mm in leads II, III, and aVF Duration: not prolonged |
| Horizontal plane | Lead V1: P wave inverted Initial upright portion may be peaked or pointed and slightly taller than normal | |
| Left atrial enlargement | Frontal plane | Axis: P waves tall in leads I; and P1 > P3 Contour: P wave bifid or M shaped seen in leads I, II, aVF, V5, and V6 Amplitude: height not increased Duration: width of P wave is increased > 2.5 mm |
| Horizontal plane | Lead V1: P wave inverted Inverted portion measures ≥ 1 mm in depth and ≥ 1 mm in duration | |
| P terminal force | Derived from multiplying the depth of terminal P wave deflection in mm by duration in s and expressed in mm/s If the P terminal forces exceed 0.03 mm/s it constitutes left atrial enlargement | |
| BBB | Left BBB | Wide QRS duration > 140 ms Lateral lead shows a tall notched R wave and V1 shows wide notched QS or Rs complex |
| Right BBB | Wide QRS duration > 140 ms V1 shows tall wide notched R (Rsr’ pattern) and lateral leads (lead I, V5, and V6) show notched wide S wave | |
| Right ventricular hypertrophy (pressure overload) | QRS complexes | RAD ≥ 90 degree qR in V1 R wave in V1 ≥ 7 mm R wave taller than S wave in V1 (R/S ratio ≥ 1) Delayed onset of intrinsicoid deflection in V1 > 0.03 rS complex in V1 to V6 with RAD S1, S2, and S3 pattern in adults |
| P wave | Right atrial abnormality | |
| ST segment and T wave | ST segment depression in V1 and V2 T wave inversion in V1 and V2 | |
| Right ventricular hypertrophy (volume overload) | Characterized by prolonged PR interval and right bundle branch block | |
| Left ventricular hypertrophy (pressure overload) | QRS complexes | R wave in any limb leads measuring ≥ 20 mm S wave in any limb leads measuring ≥ 20 mm R wave in aVL > 11 mm R wave in lead I + S in III > 25 mm S wave in V1 or V2 ≥ 30 mm R wave in V5 or V6 ≥ 30 mm R wave in V5 or V6 > 26 mm S wave in V1, V2, and V3 ≥ 25 mm R wave in V4, V5, and V6 ≥ 25 mm SV1 + RV5 or V6 > 35 mm Tallest S + tallest R in V1 to V6 > 45 mm R wave in V6 > R wave in V5 R wave in aVL + S wave in V3 > 20 mm in females and > 28 mm in males QRS voltage from all leads > 175 mm Duration of QRS ≥ 0.09 s Delayed onset of intrinsicoid deflection ≥ 0.05 s in V5 or V6 |
| P wave | Left atrial abnormality | |
| ST segment and T wave | ST segment depression T wave inversion | |
| Sokolow Lyon index | R in V5 or V6 + S in V1 ≥ 35 mm R in aVL > 11 mm | |
| Romhilt Estes score | 3 points each P wave from LA abnormality Any increase in voltage of the QRS complex R or S in limb lead ≥ 20 mm S in V1 or V2 ≥ 30 mm R in V5 or V6 ≥ 30 mm ST-T abnormalities-any shift in ST segment 2 points each LAD ≥ 30 degrees 1 point each Slight widening of the QRS complex of 0.09 s Intrinsicoid deflection in V5 or V6 of ≥ 0.05 s ST-T wave abnormalities Score of ≥ 5 is suggestive of LVH and score of 4 points is suggestive of probable LVH | |
| Cornell voltage criteria | R in aVL + S in V3 ≥ 28 mm in males and ≥ 20 mm in females | |
| Left ventricular hypertrophy (volume overload) | Characterized by prominent Q waves in leads with tall R waves in V5 or V6 accompanied by tall rather than inverted T waves | |
| Biventricular hypertrophy | Characterized by tall biphasic complexes in mid-precordial leads R + S wave in V4 > 60 mm (Katz Wachtel criteria) | |
| ST segment | Elevated | ST segment > 1.0 mm |
| Depressed | ST segment < 0.5 mm | |
aVF: augmented vector foot; aVL: augmented vector left; BBB: bundle branch block; LAD: left axis deviation; LVH: left ventricular hypertrophy; QTc interval: corrected QT interval; RAD: right axis deviation
Criteria used for echocardiography parameters taking Z score as the reference values for paediatric population
| Echocardiography measures | Criteria | |
|---|---|---|
| RA size | Measured at the end of ventricular systole Tracing of the RA is performed from the plane of tricuspid annulus along the interatrial septum, superior, and anterolateral walls of the RA RA major dimension is represented by tricuspid annulus to the superior right atrial wall and RA minor axis is from anterolateral wall to the interatrial septum | |
| RV size | Measured in end-diastole in apical 4 chamber view RV major axis is taken from diameter above tricuspid valve annulus and distance from tricuspid valve annulus to apex RV minor axis is taken in the mid cavity | |
| LA size | Measured at end-systole when the LA chamber is at its greatest dimension (prior to mitral valve opening) Dedicated acquisition of LA from the apical approach should be obtained to maximize LA length and alignment of the true long axis of the LA for area and volume measures For LA tracings: The atrioventricular interface should be represented by the mitral annulus plane 2D measure is preferred over M mode that is perpendicular to the long axis of the LA posterior wall It is measured at the level of the aortic sinuses | |
| LV size | LV internal dimension (diastole) | It is taken from inner edge to inner edge, perpendicular to the long axis of the LV, at or immediately below the level of the mitral valve leaflet tips It is performed at end-diastole (defined as the first frame after mitral valve closure or the frame with the largest LV dimensions/volume) |
| LV internal dimension (systole) | It is taken from inner edge to inner edge, perpendicular to the long axis of the LV, at or immediately below the level of the mitral valve leaflet tips It is performed at end-systole (defined as either the frame after aortic valve closure or the smallest LV dimension/volume) | |
| Aorta | Aortic annulus | Measurements of the aortic annulus should be made in the zoom mode using standard electronic calipers in mid-systole when the annulus is slightly larger and rounder than in diastole Measurement should be performed between the hinge points of the aortic valve leaflets (usually between the hinge point of the right coronary cusp and the edge of the sinus at the side of the commissures between the left coronary cusp and the non-coronary cusp) from inner edge to inner edge |
| Aortic root diameter | It is taken in parasternal long axis, high left parasternal, or high right parasternal in systole. It gives measurement of proximal aorta size | |
| Aortic sino-tubular junction diameter | It is taken in parasternal long axis, high left parasternal, or high right parasternal in systole | |
| Ascending aorta diameter | It is taken in parasternal long axis, high left parasternal, or high right parasternal at level of right pulmonary artery in systole | |
| Descending aorta diameter | It is taken in subxiphoid short axis at level of diaphragm | |
| Main pulmonary artery | Measured in parasternal short axis view in systole | |
| Right pulmonary artery | Measured in parasternal, high left parasternal, or suprasternal short axis in systole | |
| Left pulmonary artery | Measured in parasternal, high left parasternal, or suprasternal short axis in systole | |
LA: left atrium; LV: left ventricle; RA: right atrium; RV: right ventricle
The Statistical Package for Social Sciences (SPSS), version 27 (SPSS Inc., Chicago, IL, USA), was used for the statistical analysis. The sensitivity, specificity, positive predictive value, negative predictive value, positive likelihood ratio, negative likelihood ratio, and accuracy for each chest radiograph and electrocardiogram variables were calculated, in comparison with echocardiography as the gold standard diagnostic procedure. Cohen’s kappa was also calculated as a measure of concordance, or agreement, between the diagnostic methods. Generally, Cohen’s kappa value (κ) ranges from 0 to 1, where 1 implies perfect agreement and 0 implies no agreement [17]. The following interpretations were used: poor agreement < 0.20; fair agreement 0.20–0.40; moderate agreement 0.40–0.60; good agreement 0.60–0.80; and very good agreement > 0.80. P-value of < 0.05 was considered statistically significant.
A total of 50 patients (36 male, 14 female), aged 2 months to 23 years, who had a diagnosis of CHD, were included in this study. The median age of the participants was 1.9 years (interquartile range 4.95). Chest radiographs and electrocardiograms, as well as the diagnostic gold standard echocardiography, had been performed for all patients. The examples of pathologies measured on chest radiographs and corresponding changes in electrocardiograms are presented in the supplementary material (Table S1).
The findings of the chest radiographs in comparison with the diagnostic gold standard echocardiography are presented in Table 5. Chest radiographs had the highest sensitivity, specificity, and accuracy, with all being 100%, in detecting situs and cardiac position. For the detection of cardiac chamber enlargement, modest results were obtained, the sensitivity ranged from 57.89% to 84.62%, the specificity ranged from 54.17% to 74.19%, and the accuracy ranged from 50.00% to 70.00%. For the detection of cardiac chamber dilation, chest radiographs had high specificity ranging from 93.48% to 97.96% and high accuracy ranging from 90.00% to 98.00%, but lower sensitivity ranging from 25.00% to 75.00%. For the detection of the position of aortic knuckle and pulmonary arterial hypertension, chest radiographs had high specificity (97.83% and 95.24%, respectively) and high accuracy (94.00% and 82.00%%, respectively), but modest sensitivity (50.00% and 12.50%, respectively).
Sensitivity, specificity, predictive values, likelihood ratios, accuracy, and concordance of chest radiograph variables in comparison with echocardiography
| Variables | Sensitivity | Specificity | PPV | NPV | PLR | NLR | Accuracy | κ | P-value |
|---|---|---|---|---|---|---|---|---|---|
| Situs | 100.00% | 100.00% | 100.00% | 100.00% | - | 0.00 | 100.00% | 1.00 | < 0.001* |
| Cardiac position | 100.00% | 100.00% | 100.00% | 100.00% | - | 0.00 | 100.00% | 1.00 | < 0.001* |
| Cardiomegaly | 85.00% | 66.67% | 62.96% | 86.96% | 2.55 | 0.23 | 74.00% | 0.49 | < 0.001* |
| RAE | 84.62% | 54.17% | 66.67% | 76.47% | 1.85 | 0.28 | 70.00% | 0.39 | 0.004* |
| LAE | 66.67% | 71.43% | 50.00% | 83.33% | 2.33 | 0.47 | 70.00% | 0.35 | 0.012* |
| RVE | 81.82% | 41.03% | 28.13% | 88.89% | 1.39 | 0.44 | 50.00% | 0.14 | 0.163 |
| LVE | 57.89% | 74.19% | 57.89% | 74.19% | 2.24 | 0.57 | 68.00% | 0.32 | 0.023* |
| Position of AK | 50.00% | 97.83% | 66.67% | 95.74% | 23.00 | 0.51 | 94.00% | 0.54 | < 0.001* |
| AA dilation | 25.00% | 95.65% | 33.33% | 93.62% | 5.75 | 0.78 | 90.00% | 0.23 | 0.095 |
| DA dilation | - | 97.96% | 0.00% | 100.00% | - | - | 98.00% | - | - |
| MPA dilation | 50.00% | 95.65% | 50.00% | 95.65% | 11.50 | 0.52 | 92.00% | 0.46 | 0.001* |
| RPA dilation | 75.00% | 93.48% | 50.00% | 97.73% | 11.50 | 0.98 | 92.00% | 0.56 | < 0.001* |
| LPA dilation | 25.00% | 97.83% | 50.00% | 93.75% | 11.50 | 0.77 | 92.00% | 0.30 | 0.025* |
| PAH | 12.50% | 95.24% | 33.33% | 85.11% | 2.63 | 0.92 | 82.00% | 0.10 | 0.398 |
PPV: positive predictive value; NPV: negative predictive value; PLR: positive likelihood ratio; NLR: negative likelihood ratio; RAE: right atrium enlargement; LAE: left atrium enlargement; RVE: right ventricle enlargement; LVE: left ventricle enlargement; AK: aortic knuckle; AA: ascending aorta; DA: descending aorta; MPA: main pulmonary artery; RPA: right pulmonary artery; LPA: left pulmonary artery; PAH: pulmonary arterial hypertension; -: not applicable; *: concordance (agreement) between chest radiograph and echocardiography, as measured by κ, is significant at P < 0.05
There was a very good agreement between chest radiographs and echocardiography in the detection of both situs and cardiac position (κ = 1.00, P < 0.001). Moderate agreement was observed for the detection of cardiomegaly (κ = 0.49, P < 0.001), position of aortic knuckle (κ = 0.54, P < 0.001), main pulmonary artery dilation (κ = 0.46, P = 0.001), and right pulmonary artery dilation (κ = 0.56, P < 0.001). However, there was a fair agreement between chest radiographs and echocardiography in the detection of right atrium enlargement (κ = 0.39, P = 0.004), left atrium enlargement (κ = 0.35, P = 0.012), left ventricle enlargement (κ = 0.32, P = 0.023), and left pulmonary artery dilation (κ = 0.30, P = 0.025).
The findings of the comparison of electrocardiograms with the diagnostic gold standard echocardiography are outlined in Table 6. For the detection of left ventricle pressure overload, electrocardiograms had a high sensitivity (100.00%), but modest specificity (54.17%) and accuracy (56.00%). For the detection of left atrial enlargement and left ventricle volume overload, electrocardiograms had high specificity (94.12% and 94.29%, respectively) and modest accuracy (72.00% and 80.00%, respectively), but low sensitivity (25.00% and 46.67%, respectively). The accuracy of detecting other electrocardiogram variables ranged between 60.00% to 70.00%, despite the sensitivity ranging between 50.00% and 86.36%, and specificity ranging between 57.14% and 77.27%.
Sensitivity, specificity, predictive values, likelihood ratios, accuracy, and concordance of electrocardiogram variables in comparison with echocardiography
| Variables | Sensitivity | Specificity | PPV | NPV | PLR | NLR | Accuracy | κ | P-value |
|---|---|---|---|---|---|---|---|---|---|
| RAE | 53.57% | 77.27% | 75.00% | 56.67% | 2.35 | 0.60 | 64.00% | 0.30 | 0.027* |
| LAE | 25.00% | 94.12% | 66.67% | 72.73% | 4.25 | 0.80 | 72.00% | 0.23 | 0.052 |
| RV-PO | 86.36% | 57.14% | 61.29% | 84.21% | 2.02 | 0.24 | 70.00% | 0.43 | 0.002* |
| RV-VO | 63.64% | 58.97% | 30.47% | 85.19% | 1.55 | 0.62 | 60.00% | 0.16 | 0.184 |
| LV-PO | 100.00% | 54.17% | 8.33% | 100.00% | 2.18 | 0.00 | 56.00% | 0.09 | 0.133 |
| LV-VO | 46.67% | 94.29% | 77.78% | 80.49% | 8.17 | 0.57 | 80.00% | 0.46 | < 0.001* |
| BVH | 50.00% | 62.50% | 5.26% | 96.77% | 1.33 | 0.80 | 62.00% | 0.03 | 0.709 |
PPV: positive predictive value; NPV: negative predictive value; PLR: positive likelihood ratio; NLR: negative likelihood ratio; RAE: right atrial enlargement; LAE: left atrial enlargement; RV: right ventricle; LV: left ventricle; PO: pressure overload; VO: volume overload; BVH: biventricular hypertrophy; *: concordance (agreement) between electrocardiogram and echocardiography, as measured by κ, is significant at P < 0.05
There was a moderate agreement between electrocardiograms and echocardiography in the detection of right ventricle pressure overload (κ = 0.43, P = 0.002) and left ventricle volume overload (κ = 0.46, P < 0.001). Fair agreement was observed for the detection of right atrial enlargement (κ = 0.30, P = 0.027), and non-significant fair agreement for left atrial enlargement (κ = 0.23, P = 0.052). However, other electrocardiogram variables had poor agreement with echocardiography.
Given that undiagnosed CHD can lead to life-threatening cardiovascular collapse and cardiac arrest, which are leading causes of death in children, screening and early detection of CHD are vital [7, 18]. Traditional teaching methods always highlight chest radiographs and electrocardiograms as essential tools that add substantial value to the diagnosis of cardiac diseases in children [11]. However, the role of chest radiographs and electrocardiograms in the detection of CHD is still questionable due to previous studies showing low sensitivity and specificity of these diagnostic tools [8, 19, 20]. Nonetheless, prior studies do recommend routine use of chest radiographs and electrocardiograms for the preliminary detection of CHD [8, 11].
The current study demonstrated the role of chest radiographs and electrocardiograms in predicting the hemodynamics of CHD, taking echocardiography as the diagnostic standard. CHD with right sided obstructive lesions (tetralogy of Fallot, pulmonary stenosis), aortic stenosis, and pulmonary artery hypertension cause pressure overload, whereas, left to right shunts such as ventricular septal defect and patent ductus arteriosus cause volume overload. The hemodynamics of these pressure overload and volume overload conditions can be assessed by chest radiographs and electrocardiograms. Chest radiographs had the highest sensitivity, specificity, and accuracy, with all being 100.00%, in detecting situs and cardiac position. There was a very good agreement between chest radiographs and echocardiography in the detection of both situs and cardiac position, while moderate agreement was observed for the detection of cardiomegaly, position of aortic knuckle, main pulmonary artery dilation, and right pulmonary artery dilation. Electrocardiograms had a high sensitivity of 100.00%, but modest specificity and accuracy for the detection of left ventricle pressure overload. For the detection of left atrial enlargement and left ventricle volume overload, electrocardiograms had high specificity but low sensitivity and modest accuracy. There was a moderate agreement between electrocardiograms and echocardiography in the detection of right ventricle pressure overload and left ventricle volume overload. Varied results were obtained for other chest radiograph and electrocardiogram variables in terms of sensitivity, specificity, accuracy, and concordance with echocardiography. Nonetheless, the study findings indicate that chest radiographs and electrocardiograms alone are not adequate for the assessment of hemodynamics of CHD and reinstates the recommendation that in addition to routine chest radiographs and electrocardiograms, echocardiography should be performed.
In this study, the sensitivity and specificity of chest radiographs for the detection of cardiomegaly were 85.00% and 66.67%, respectively with a positive predictive value of 62.96% and a negative predictive value of 86.96%. In a study conducted by Satou et al. [21], chest radiographs had a high specificity (92.30%) and negative predictive value (91.10%), a low sensitivity (58.80%) and positive predictive value (62.50%) in predicting cardiac enlargement in children. Nonetheless, the presence of cardiomegaly can be suspected if the cardiothoracic ratio is > 60% in neonates, > 55% in infants, and > 50% in children. In this study, accuracy of the chest radiograph in detecting cardiac chamber enlargement was 70.00% for right and left atrium, 50.00% for right ventricle, and 68.00% for left ventricle, which was lower than that reported in a prior study [11]. Tumkosit et al. [22] reported moderate to high accuracy (73–92%) and specificity (61–96%) of chest radiographs to characterize pulmonary vascularity patterns, with moderate to good agreement (κ = 0.53–0.67). In our study, although high accuracy (82.00%) and specificity (95.24%) were obtained for the detection of pulmonary arterial hypertension, there was poor agreement between chest radiographs and echocardiography (κ = 0.1).
In the current study, the sensitivity, specificity, and accuracy of electrocardiogram in detecting right atrial enlargement were 53.57%, 77.27%, and 64.00%, respectively, which were lower than the 100.00%, 97.70%, and 98.50% reported in a prior study [11]. The differences in the results could be attributed to the differences in sample size as well as the age group of patients included in the study. There is also a possibility of differences in measurement methods used; while this study used standard criteria for detecting right atrial enlargement [13], the criteria used have not been indicated in the prior study [11].
Electrocardiogram had a high sensitivity (100.00%), modest specificity (54.17%), and accuracy (56.00%) for the detection of left ventricle pressure overload, but modest sensitivity (50.00%), specificity (62.50%), and accuracy (62.00%) for detecting biventricular hypertrophy. Murphy et al. [23] suggest that the use of a single criterion to detect left ventricular hypertrophy is often ineffective when the patients under study have diverse cardiac diseases and recommend using methods that integrate multiple electrocardiographic criteria.
While this study was focused on the role of chest radiographs and electrocardiograms in predicting the hemodynamics of CHD taking echocardiography as the diagnostic standard, several prior studies have investigated the accuracy of these tools in detecting several cardiac defects. Danford et al. [8] demonstrated that chest radiographs and electrocardiograms had no independent advantage for defect-specific diagnosis of cardiac murmurs in children. The findings of many prior studies indicate that chest radiographs and electrocardiograms have low sensitivity and specificity that can result in the misinterpretation of diagnosis for CHD [7, 19, 20, 22, 24, 25]. In a retrospective study by Laya et al. [19], the authors concluded that chest radiograph alone is not diagnostic of specific congenital cardiac lesions. Similarly, Fonseca et al. [26] reported that chest radiography had a low sensitivity for structural heart disease, and concluded that chest radiography does not function as a screening test for neonates with suspected heart disease, particularly in small or premature neonates. Birkebaek et al. [25] evaluated the diagnostic value of chest radiography and electrocardiography while evaluating if asymptomatic children with a cardiac murmur had heart disease as defined by echocardiography. However, their study demonstrated no role of these diagnostic tools in the detection of heart disease. Corroborating the findings of the aforementioned studies, this study identified the need for other diagnostic tools in addition to chest radiographs and electrocardiograms for the preliminary diagnosis of CHD.
To the best of our knowledge, this study is one of the first to evaluate the role of chest radiographs and electrocardiograms in predicting the hemodynamics of CHD, taking echocardiography as the diagnostic standard. Set in a real-world clinical setting, this study illustrates the importance of these readily available and economically viable imaging tools for predicting the hemodynamics of CHD, especially in resource-constraint settings. Nonetheless, this study has a few limitations. As the data were collected retrospectively from the hospital records, the skills of the individuals performing and reporting the chest radiographs, electrocardiograms, and echocardiography were not assessed, which could have increased the technical variability. However, the chest radiographs and electrocardiograms were evaluated and compared with the final diagnosis of echocardiography by a pediatric cardiologist in this study. In recognizing the limitations of our study, including the exclusion of specific blood flow criteria, future research can fuse prospectively and comprehensively into this dimension of CHD hemodynamics. Due to the retrospective nature of this study, there were a number of patients who could not be tracked for further evaluation. Consequently, this led to a small sample size that, although modest, was deemed sufficient (n = 50). Prospective clinical studies that include large sample sizes are needed to support or refute the findings from this study regarding the hemodynamic evaluation of CHD using chest radiographs and electrocardiograms, as compared to echocardiography. In the context of evolving diagnostic imaging for CHD, our study, while focusing on chest radiographs and electrocardiograms, acknowledges the need to discuss the current relevance and utility of these traditional tools alongside advanced modalities like MRI, and CT scan. Future research can explore the synergy between these techniques for comprehensive CHD assessment.
This study is one of the first to evaluate the role of chest radiographs and electrocardiograms in predicting the hemodynamics of CHD, taking echocardiography as the diagnostic standard. In detecting situs and cardiac position, chest radiographs had the highest sensitivity, specificity, and accuracy, along with a very good agreement with echocardiography. While modest to high sensitivity, specificity, and accuracy, along with moderate agreement with echocardiography, were obtained for some chest radiograph and electrocardiogram variables, varied results were obtained for other variables. Overall, the study findings indicate that chest radiographs and electrocardiograms alone are not adequate for the assessment of hemodynamics of CHD and reinstates the recommendation that in addition to routine chest radiographs and electrocardiograms, the diagnostic gold standard echocardiography should be performed.
CHD: congenital heart disease
CT: computed tomography
MRI: magnetic resonance imaging
TGA: transposition of the great arteries
κ: Cohen’s kappa value
The supplementary material for this article is available at: https://www.explorationpub.com/uploads/Article/file/1001210_sup_1.pdf
The authors acknowledge the in-kind support provided by the Philanthropy Nepal (Paropakari Nepal) Research Collaboration.
Romila C: Conceptualization, Data curation, Formal analysis, Writing—original draft. GK: Conceptualization, Data curation. KR: Conceptualization, Formal analysis, Writing—original draft. Ritesh C: Formal analysis, Writing—original draft. RA and KSD: Conceptualization. NA: Conceptualization, Data curation. All authors critically reviewed the original draft. All authors have read and agreed to the published version of the manuscript.
The authors declare no conflicts of interest.
The study was conducted in accordance with the Declaration of Helsinki, and approved by the Institutional Ethics Committee, Devki Devi Foundation (Reference No: RS/MSSH/DDF/SKT-2/IEC/PED-CARDIO/20-44).
Patient consent was waived as the data were collected retrospectively from the hospital records.
Not applicable.
The data used to support the findings of this study are available from the corresponding author upon request.
Not applicable.
© The Author(s) 2024.
Copyright: © The Author(s) 2024. This is an Open Access article licensed under a Creative Commons Attribution 4.0 International License (https://creativecommons.org/licenses/by/4.0/), which permits unrestricted use, sharing, adaptation, distribution and reproduction in any medium or format, for any purpose, even commercially, as long as you give appropriate credit to the original author(s) and the source, provide a link to the Creative Commons license, and indicate if changes were made.

View: 6093
Download: 97
Times Cited: 0