Original Article

Affiliation:
1College of Interdisciplinary Science and Technologies, School of Intelligent Systems, University of Tehran, Tehran 1439957131, Iran
ORCID: https://orcid.org/0009-0005-7321-7993
Affiliation:
1College of Interdisciplinary Science and Technologies, School of Intelligent Systems, University of Tehran, Tehran 1439957131, Iran
Email: h.veisi@ut.ac.ir
ORCID: https://orcid.org/0000-0003-2372-7969
Affiliation:
2Department of Optometry, School of Rehabilitation Science, Iran University of Medical Sciences, Tehran 14496-14535, Iran
ORCID: https://orcid.org/0000-0002-4451-800X
Affiliation:
1College of Interdisciplinary Science and Technologies, School of Intelligent Systems, University of Tehran, Tehran 1439957131, Iran
ORCID: https://orcid.org/0000-0001-9510-1944
Explor Digit Health Technol. 2025;3:101175 DOI: https://doi.org/10.37349/edht.2025.101175
Received: June 25, 2025 Accepted: October 30, 2025 Published: December 08, 2025
Academic Editor: Atanas G. Atanasov, Medical University of Vienna, Austria
The article belongs to the special issue Deep Learning Methods and Applications for Biomedical Imaging
Aim: Patients diagnosed with irregular astigmatism often require specific methods of vision correction. Among these, the use of a rigid gas permeable (RGP) lens is considered one of the most effective treatment approaches. This study aims to propose a new automated method for accurate RGP lens base-curve detection.
Methods: A multi-modal feature fusion approach was developed based on Pentacam images, incorporating image processing and machine learning techniques. Four types of features were extracted from the images and integrated through a serial feature fusion mechanism. The fused features were then evaluated using a multi-layered perceptron (MLP) network. Specifically, the features included: (1) middle-layer outputs of a convolutional autoencoder (CAE) applied to RGB map combinations; (2) ratios of colored areas in the front cornea map; (3) a feature vector from cornea front parameters; and (4) the radius of the reference sphere/ellipse in the front elevation map.
Results: Evaluations were performed on a manually labeled dataset. The proposed method achieved a mean squared error (MSE) of 0.005 and a coefficient of determination of 0.79, demonstrating improved accuracy compared to existing techniques.
Conclusions: The proposed multi-modal feature fusion technique provides a reliable and accurate solution for RGP lens base-curve detection. This approach reduces manual intervention in lens fitting and represents a significant step toward automated base-curve determination.
For patients with corneal conditions such as irregular astigmatism or corneal thinning, traditional vision correction methods like glasses or soft contact lenses may not provide sufficiently sharp and accurate vision. It is important to note that corneal thinning does not necessarily imply surface irregularities. The use of rigid gas permeable (RGP) contact lenses is among the practical treatment methods for these patients. In this regard, ophthalmologists and lens fitting specialists perform several trials and errors to achieve the final fit. Despite relying on years of experience and expertise, at times it is difficult for a specialist to make a final diagnosis of the specifications of the lens based on continuous assessments [1].
Until now, optometrists have been performing lens fitting based on two main perspectives: manual-based and device-based methods. In the manual method, the specialist selects the lens based on experience and knowledge from Pentacam maps or information related to the patient during the trial-and-error process. In addition to being time-consuming, this process can cause scratches and changes in the surface of the cornea due to successive tests. The device-based method, on the other hand, attempts to predict lens properties using available samples, device statistics, calculations, and regression equations. In these conditions, drawbacks such as the limitation of the statistical population, which has a low success rate, are concerning [2]. With the increase in the statistical community, the percentage of this success may be less than that of a higher patient rate. Therefore, manual and device-based methods need more improvement.
This paper attempts to provide a procedure in the form of a computer-assisted detection (CAD) system [3] to assist experts in detecting the final RGP lens fit, reducing the long trial-and-error-based process time. Previous studies [4–6] employed classical image processing methods and basic or pre-training convolutional neural networks (CNNs). These methods, along with three feature fusion techniques [i.e., mono-view analysis, combinatory feature fusion, and canonical correlation analysis (CCA)], were applied to Pentacam images. The three methods for determining the base-curve of the lens had the best results of the mean squared error (MSE) of 0.053, 0.056, and 0.057, respectively. In the study [7], a convolutional autoencoder (CAE) was utilized for feature fusion on multi-view Pentacam images, achieving an MSE of 0.014 and an R-squared score of 0.53.
In this study, the design of a deep neural network is used to combine the multi-modal features [8] of different sections in Pentacam’s four refractive maps to determine the properties of the RGP lens. These networks have been used for the first time to provide a vector of common features of the maps and parameters of images. Furthermore, the prediction of hard lens specifications is done automatically and without contact with the eye surface, and only from images. The contributions and achievements of this research can be presented in the form of the following:
Providing a new approach to processing Pentacam four refractive images to get a new and effective set of features.
Designing a method based on deep neural networks with minimal human intervention, and based on eye surface conditions.
Using multi-modal feature fusion for the first time to determine the RGP lens specification.
A summary of the following sections is given. In this section, the background of the research is given, and related works are discussed. In Materials and methods, the method of research was explained. In Results, the results of different methods were presented and analyzed. In Discussion, conclusions are made, and possible suggestions for continuing this research path are given.
In this section, a literature background related to this research is provided, which includes the cornea and keratoconus, base-curve, Pentacam, machine learning methods, CNNs, feature reduction and information fusion, and multi-view learning.
The cornea is a clear, glass-like structure at the front of the eye, generally aspherical in shape, with curvature gradually decreasing from the center toward the periphery. Keratoconus is an abnormal protrusion of the cornea, where the central part becomes cone-shaped instead of normally arched. The healthy cornea is typically round or spherical, but in keratoconus, it bulges into a cone. These changes affect the refraction of light entering the eye, reducing image sharpness.
RGP lenses are among the most widely used hard lenses that improve vision in corneal astigmatism. For individuals with irregular corneas, such as keratoconus patients, RGP lenses provide superior visual quality compared to glasses. These lenses are gas permeable (GP), allowing oxygen to reach the cornea.
The best-fit sphere (BFS) provides a spherical reference surface for assessing corneal shape, whereas the best-fit toric ellipsoid (BFTE) models aspheric or toric surfaces, offering a more anatomically accurate representation of irregular corneas. This distinction is clinically important for selecting the appropriate GP lens base-curve.
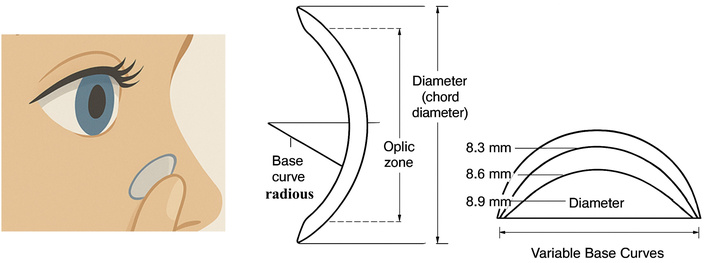
Base-curve or base-curve radius, which is shown in Figure 1 (right), is a measure of an important parameter of a lens. The higher the number of base curves, the flatter the curve of the lens, and vice versa. Typical values for the RGP lens are 6.0 to 10.0 mm for keratoconus eyes.
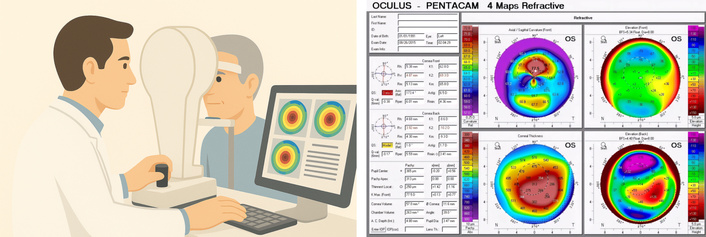
The Pentacam is a rotating Scheimpflug camera, which is one of the diagnostic tools to aid in clinical decision-making. This device is capable of numerous measurements and analyses on the cornea and other parts of the eye and provides a large amount of valuable data related to the anterior and posterior corneal surfaces, non-contact [2]. To determine the hard lens specifications, the Pentacam four images include elevation front, elevation back, corneal thickness, and axial/sagittal curvature [9]. Figure 2 shows an example image of a Pentacam and a Pentacam device.
In this study, we used an image processing and deep learning approach to determine the RGP lens base curve. Among various machine learning methods, deep learning is particularly effective due to its ability for automatic feature extraction and representation learning [10]. CNNs [11] are widely used for image classification and have shown strong performance in pattern recognition tasks [12–15]. In our work, a CAE was employed for feature extraction and dimensionality reduction.
High-dimensional datasets can suffer from the curse of dimensionality [16], making dimensionality reduction a critical step in pattern recognition and machine learning tasks [17]. Various strategies exist, including feature selection, feature extraction, and feature fusion [18–20]. In this study, four different feature vectors were extracted: FV1 from the CAE, FV2 from the color area ratio, FV3 from cornea front parameters, and FV4 from the radius of the reference sphere/ellipse. We applied serial feature fusion (FV1 + FV2 + FV3 + FV4) before classification to generate a richer and more discriminative representation [19].
Information fusion techniques such as multi-modal [14, 21] and multi-view learning [22] improve model performance by combining complementary information. Multimodal learning integrates different data types (e.g., images, text, clinical parameters) to leverage diverse sources, which enhances robustness and sensitivity to noise [14, 21]. Multi-view learning focuses on combining different views of the same modality (e.g., multiple Pentacam maps), as these views contain complementary information compared to single-view data [22].
Multi-view representation learning can be categorized into multi-view alignment and multi-view representation fusion. In multi-view alignment, two views x and y are mapped together, while in multi-view fusion, these views are integrated into a single compact representation [22].
In this study, we applied multi-view representation fusion using autoencoders to integrate four Pentacam maps into a single compact feature vector. This fused representation provides richer and more discriminative features for the classification task compared to individual maps [22].
In this section, two categories of related works are reviewed. From one perspective, manual and device-based lens fitting methods are reviewed, and from another perspective, we present research concerning machine learning and image processing in the lens fitting area.
In this section, we focus our review on studies that have been based on traditional diagnostic approaches. Although these studies have a different nature, they consist of a conceptual similarity to the subject of RGP lens specification detection.
So far, the RGP lens specifications have been identified manually or by the device. Ortiz-Toquero et al. in 2019 [2] surveyed and summarized all manual and device-based methods. Various strategies have been introduced, in which different devices were employed to measure the patient’s cornea and to provide calculations and parameters. Each method established a regression equation relating the device-derived parameters to the actual RGP lens base curve. These regression equations received the calculated parameters as input and yielded the predicted RGP lens base curve as output.
For instance, different regression-based strategies have reported varying levels of accuracy. APEX software and a univariate regression approach showed relatively better results with absolute differences around 0.10–0.16 mm and success rates of 26–41% [23]. Other univariate or multivariate regressions reported larger errors (0.13–0.39 mm) with success rates ranging from 3.8% to 34.6% [24–30]. Among all, the Calculens algorithm demonstrated the highest performance, with the lowest absolute difference (0.09 ± 0.08 mm) and the best success rate (50.6%) [31].
In an experiment on 46 patients (25 men and 21 women, 19−66 years old) and 81 eyes with keratoconus, these guidelines were compared. The results revealed considerable statistical differences between the proposed regression-based base curves and the final fitted base curves, indicating a lack of clinical validation in many guidelines. Among them, the Calculens algorithm appeared to be a better choice for determining a starting point in the RGP lens fitting process in keratoconus eyes [2]. Although these studies advanced the field of optimal lens fitting and specification detection, they may achieve greater promise when integrated with machine learning and image processing techniques, potentially reducing errors in the process.
The most related and in-line research, close to this work, are [4–6]. In these works, the images provided by the four refractive maps in Pentacam have been used to determine the RGP lens base curve. First, two approaches of classic [4] and deep [6] techniques for feature extraction are presented to analyze and extract features. In the classic approach [4], researchers denoise the maps and then crop each map. They use a radial-sectoral segmentation for color quantification and segment each map based on the dominant segment color. In this method, the large-scale color variation is converted to 10, 18, and 33 base colors, and as a result, allows feature extraction based on converting the input maps to singular feature vectors. Finally, for dominant color representation, 32 and 64 feature vectors were obtained based on the representative color for each image.
In the deep image processing approach [6], two methods of CNNs from scratch and transfer learning-based CNNs have been used. In the CNNs from scratch method, the CNN is designed from scratch, and the four maps provided by Pentacam’s four refractive maps are used in network training. In the transfer learning-based model, AlexNet, ResNet, and GoogleNet CNNs are used to transfer learning from the mentioned pre-training networks to the Pentacam four refractive maps. After applying the image processing techniques, each of the input views is connected to the fusion layer, which applies feature fusion to the features. These methods include mono-view map analysis, combinatory fusion, and CCA [6]. Finally, all features are provided as input feature vectors to a multi-layered perceptron (MLP) neural network to determine the RGP lens base curve.
In [7], a new method based on the autoencoder-based feature extraction technique from Pentacam images has been proposed. This research was initiated by preprocessing the labeled data provided by the Pentacam’s four refractive maps. In [7], to aggregate (fuse) and present the feature vector of the multi-view maps (/images/inputs), the autoencoder neural network is used. In [7], the views refer to different maps of the cornea in Pentacam images. The feature vector obtained at the middle layer of the autoencoder, referred to as the bottleneck of the network, is connected to the multi-layer perceptron neural network. The output of the network is in the form of a regression node that determines a singular value predicting the RGP lens base curve. The evaluation of the model is analyzed and discussed in the form of the criterion of MSE and the coefficient of determination. In [7], many experiments were performed with different combinations of features lying beneath the Pentacam four refractive maps to determine the base-curve of the lens. The result shows that the highest performance (MSE = 0.014, R2 = 0.53) is related to the RGB channel composition based on the four refractive maps as an input to a CAE to extract features to determine the base-curve.
Other related works have addressed the use of machine learning and image processing for diagnoses and other classification tasks, but not for RGP lens fitting cases. Among them, the studies have confirmed the high accuracy of using machine learning models to diagnose corneal disease using the Scheimpflug camera and corneal topography indicators [12]. In [32], a neural network has been used to diagnose irregular astigmatism from data on keratoconus types I to III and data related to normal eyes. The proposed hybrid system has several basic classifiers so that each classifier is trained with only a specific part of the training data. In this hybrid system, the integration of several classifiers is used as an expert system, and a gateway network is used to combine the results of the classifiers. The results show 92 percent accuracy in diagnosis.
In another work [12], a CNN has been used to discriminate keratoconus, subclinical keratoconus, and normal cornea using color-coded Scheimpflug images. The average accuracy of the CNN classifier was 0.98 and 0.96 for the training and test sets, respectively [12].
Table 1 summarizes previous research with their best-achieved results.
Summary of previous research with the best method and result.
| Research | Subject | Method | Result |
|---|---|---|---|
| [2] | Determining the base curve by manual and device-based methods | Calculens algorithm | Success rate 50.6% |
| [6] | Determining the base curve based on CAE features | Basic CAE and pre-trained CAE on the features of Pentacam images | MSE = 0.056 |
| [4] | Image processing/machine learning-based RGP lens base-curve determination on Pentacam four refractive maps | Classical image processing method with combinatory feature fusion | MSE = 0.053 |
| [5] | Deep learning-based CCA fusion determining RGP lens base-curve on Pentacam four refractive maps | Deep learning feature extraction and CCA feature fusion | MSE = 0.056 |
| [7] | Deep learning-based autoencoder fusion determining RGP lens base-curve on Pentacam four refractive maps | Deep learning feature extraction and CAE feature fusion | MSE = 0.014R2 = 0.53 |
| [33] | Novel deep learning approach to estimate RGP contact lens base-curve for keratoconus fitting | Using the U-net architecture | MSE = 0.05 |
| [32] | Classification of Pentacam images into four categories: type I to III keratoconus and natural eyes | Integrate multiple classifiers as an expert system and a gateway to combine the results of categories (each category is trained with a specific piece of training data) | Accuracy = 92% |
| [12] | Categorization of Pentacam images is categorized into three classes: keratoconus, subclinical keratoconus, and normal cornea with Pentacam images | Pre-processing of images and a convolutional neural network | Accuracy = 98% |
CAE: convolutional autoencoder; CCA: canonical correlation analysis; RGP: rigid gas permeable.
The summary and shortcomings of existing techniques are shown in Table 2.
The summary and shortcomings of existing techniques.
| Number | Existing techniques | Shortcomings |
|---|---|---|
| 1 | Manual methods |
|
| 2 | Devise based methods |
|
| 3 | Machine learning and image processing methods |
|
MSE: mean squared error.
The remainder of this paper is organized as follows: Materials and methods details the materials and methods employed in this study. Results reports the results obtained from the proposed approach. Discussion discusses the findings in the context of existing literature and highlights potential directions for future work.
In this study, all lens fittings were performed using a standardized RGP lens model to ensure consistency across cases. Specifically, a TGT lens with a 9.30 mm diameter, tri-curve design, and BOSTON XO material was utilized. This lens design is comparable to Boston and Wohlk hard lenses. The fitting process was conducted according to the “three-point touch” method, ensuring optimal centration and adequate movement. In cases where proper fitting was not achievable with the specified lens, patients were excluded from the study. These excluded cases were subsequently fitted with alternative RGP or scleral lenses, but their results were not included in the dataset.
For all included cases, the base curve was selected according to the manufacturer’s protocol (K + 0.2 mm). The classification of corneal irregularity and the inclusion criteria were based on the Pentacam keratoconus report, covering mild, moderate, and severe keratoconus stages. It should be noted that the keratoconus pattern can influence the fitting outcome; for example, nipple cones and para-central cones are often more amenable to successful fitting.
It is important to highlight that the base curve values reported in this study are specific to the lens model and design used, and may not be directly transferable to lenses from other manufacturers. Furthermore, since the base curve of a GP lens is affected by its diameter, the results of this study should be interpreted in the context of the fixed 9.30 mm lens diameter applied in all cases. This standardization enhances internal validity while limiting the generalizability of the findings to other lens geometries.
It should be noted that individual clinical profiles, such as patient name, age, and other personal identifiers, were not used in this study based on the physician’s guidance. Only Pentacam measurements and map outputs were employed as inputs for the AI model.
In this study, the anterior corneal maps were used as the primary determinants for RGP lens base curve prediction. Posterior corneal maps, provided by the Pentacam device, were included as additional input features to improve the model’s understanding of corneal shape patterns. No individual clinical data, such as visual acuity or patient demographics, were used; only quantitative Pentacam measurements and map outputs were employed as inputs to the AI model. Posterior elevation maps were generated using a best-fit ellipsoid (BFE), which more accurately represents the aspherical nature of the cornea while the lens itself remains spherical.
Visual function parameters (e.g., distance visual acuity, contrast sensitivity, or subjective quality-of-vision ratings) were not incorporated into the dataset or the base-curve calculation. For all included cases, the ground-truth base curve label was defined exclusively by the achieved fitting quality—optimal centration, appropriate movement, and an acceptable fluorescein pattern—using a standardized RGP design (TGT lens, 9.30-mm diameter, tri-curve, BOSTON XO material) fitted with the “three-point touch” technique and the manufacturer’s starting rule of K + 0.20 mm. Accordingly, the labels reflect a clinically acceptable fit rather than measured visual performance outcomes.
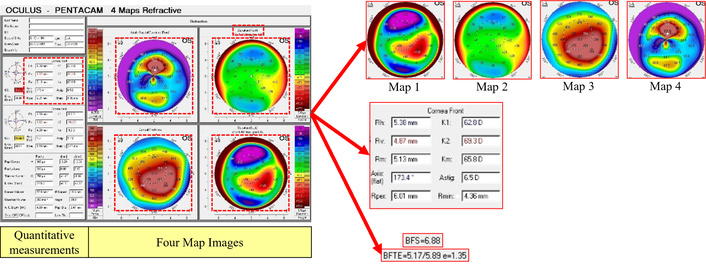
Pentacam images provide a large amount of valuable data on the anterior and posterior corneal surfaces [34]. To determine the RGP lens specifications, Pentacam’s four refractive maps consist of the axial/sagittal curvature map, elevation (front), elevation (back) map, and the corneal thickness analyzed [35].
These images provide different views of the corneal conditions in patients with irregular astigmatism associated with their respective labels, the base curve of the final fitted RGP lens. As shown in Figure 3, Pentacam images consist of two sections: the quantitative measurements (provided at the left sidebar) and four map images (located at the right side of the Pentacam image). According to experts and lens fitting specialists, and associated studies to this research, we have focused on two different types of feature sets; one, an output of image processing techniques containing four maps, and the other output being the cornea (front) parameters.
Distinction of Pentacam four refractive map outputs based on image processing techniques.
The data used in this paper consists of 247 Pentacam images of patients diagnosed with irregular astigmatism and labeled with an RGP lens base-curve provided in research [4–6]. The data used in all experiments performed in this study were randomly classified into three groups: the training set, validation set, and test data set, containing 70%, 15%, and 15% of the samples in the dataset, respectively.
Both anterior and posterior elevation maps were generated using the Pentacam’s default BFS reference surface for an 8.0 mm central zone. This approach was selected to align with the spherical geometry of GP lens base-curves and standard clinical fitting practices. While BFE surfaces can capture the aspheric nature of the cornea more precisely, BFS was used to maintain consistency across all samples and ensure direct clinical relevance to spherical base-curve selection.
The dataset utilized in this study is identical to that used in our previous related works [4–7], which were collected and curated by the same research team. Nevertheless, the present study applies a new multimodal feature extraction and fusion methodology aimed at determining RGP lens base-curve specifications, which distinguishes it from the earlier analyses.
A series of preprocessing techniques was first applied to use the images in the proposed model, as shown in Figure 4a. In the first step, the background was removed from the Pentacam maps with a size of 287 × 287. Afterward, the maps were resized to 81 × 81, then a 7 × 7 median filter was applied for the sole purpose of denoising the maps.
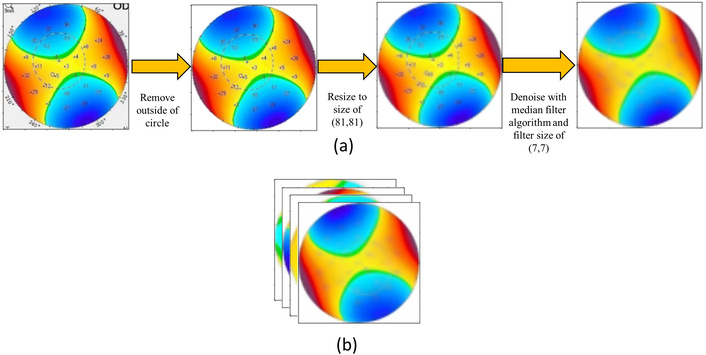
Preprocessing and channel concatenation of Pentacam maps. (a) Background removal, resizing, and median filtering for denoising; (b) concatenation of all preprocessed maps along axis 3, resulting in a 12-channel input image.
As shown in Figure 4b, all maps were preprocessed and then concatenated on axis 3 through channel concatenation. The channel size of the input image would be 12, as it contains four maps with a three-channel size.
An overview of the proposed architecture with the fusion of four feature vectors from Pentacam images is given in Figure 5. The proposed method consists of four sets of feature vectors. “Feature vector 1” comes from the bottleneck of a CAE based on the images containing four maps. “Feature vector 2” is obtained by calculating the color area ratio of the elevation (front) map in the image section. “Feature vector 3” is obtained by elevation (front) parameters from measured parameters. “Feature vector 4” defines the reference radius of the anterior corneal elevation, denoted by the term BFS or BFTE above the anterior elevation map. In the end, all features are concatenated based on different combinations and passed through an MLP to recognize the labels of test data [8]. As it is presented in the experiment section, various combinations of the feature vectors are evaluated, especially each feature vector alone. Following, we will embark upon a detailed description of all feature vectors.

Overview of the proposed method of multi-modal feature fusion from Pentacam images. BFS: best-fit sphere; BFTE: best-fit toric ellipsoid; MLP: multi-layered perceptron; NN: neural network.
First, in an experiment, all four maps were individually resized to 88 × 88 pixels and then, inspired by the MNIST CAE model, were passed through the CAE to extract bottleneck features.
In this experiment, 11,616 features were extracted from the bottleneck layer of MNIST CAE, reducing the number of colors in the Pentacam spectrum to five, as shown in Figure 6.
In another attempt to decrease the number of features in the CAE bottleneck from 11,616, the images were resized to 32 × 32, resulting in 48 features. The model of the CAE was the MNIST CAE model. This resulted in a seven-color group, explained in detail in Feature vector 2: the ratio of color area.
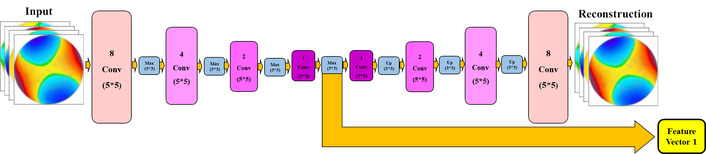
To decrease the number of features of the CAE bottleneck, in the next experiment, the CAE model was changed to the proposed architecture shown in Figure 7.
Proposed CAE architecture: In the proposed architecture, the input size of the CAE is (81, 81, 12), which consists of four maps concatenated through their RGB channels. There are eight layers of convolution filters with a size of (5, 5) in the following order (8, 4, 2, 1, 1, 2, 4, 8). At the first four layers, a max-pooling layer of size (3, 3) is used after each convolution layer, and for the next four layers, an up-sampling layer of size (3, 3) is inserted after each convolution layer. The architecture of the proposed method is shown in Figure 7. In the implementation of this architecture, the Adam optimizer and binary cross-entropy loss were applied in the network. The number of epochs was 20. After the training, the bottleneck of CAE was extracted as feature vector 1.
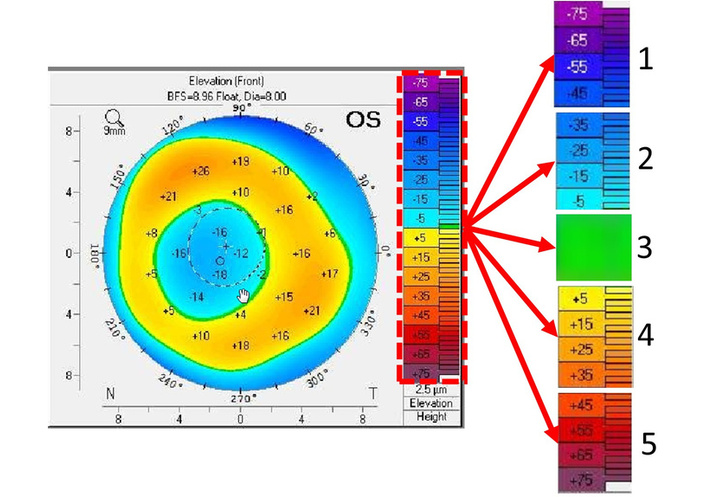
According to experts’ experiences in the ophthalmology and lens fitting field, one of the most important parameters in determining the base curve of an RGP lens is the area of colors in the elevation (front) map (map2). Because map2 shows the elevation of the front of the cornea, the lens is placed directly on the surface of the front of the cornea. The placement of this map is in the upper left corner of the Pentacam four refractive map, as illustrated in Feature vector 4: sphere and ellipse radius. Accordingly, we have extracted these ratios as a feature vector.
In this method, the color ranges are detected, and then the ratio of the number of their pixels is calculated for each color range (Figure 8a). As shown in Figure 8b, there are two types of the color spectrum on the right side of the elevation (front) map. These color spectrums were merged to provide a singular color range with 7 colors.
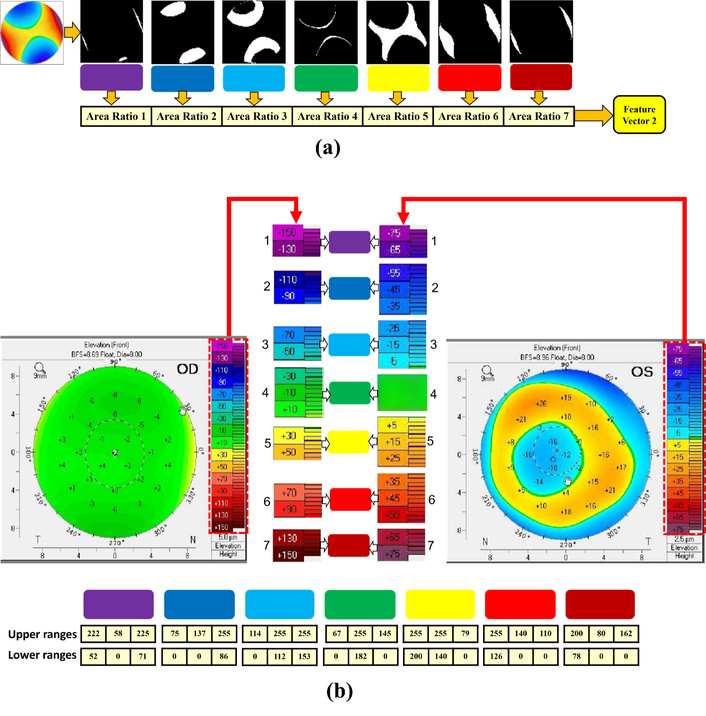
Summary of the color-area-based feature extraction process. (a) Calculating the color area on map2 (front cornea); (b) merging the two color spectrums to obtain a unified 7-color range.
According to ophthalmologists and lens fitting experts, other parameters that have a direct effect on the RGP lens base curve are the front corneal parameters, located on the upper part of the quantitative measurement section of each image. The importance of these specifications and measurements is based on the fact that RGP lenses are fitted on the frontal part of the cornea, highlighting that the front elevation map is important in determining the base curve. As shown in Figure 9, in this method, the front cornea parameters were cropped, and then the image was converted to text using Google’s OCR service. All numbers were extracted and used as the third feature vector of the proposed model.
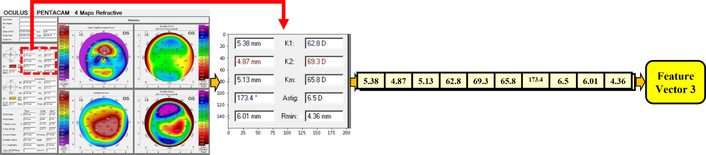
The stages of extracted parameters (related to the cornea front) from the “parameters part” in Pentacam images.
After automatic text extraction via OCR, each recognized output was manually checked to confirm correctness. This verification step ensured that all OCR-derived textual features were error-free before inclusion in the analysis.
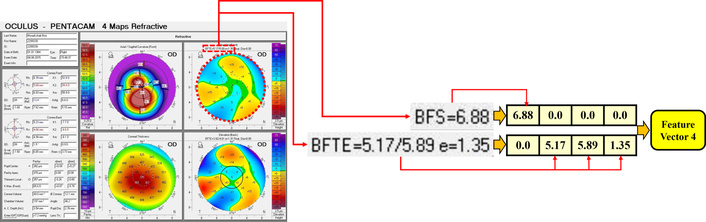
The Pentacam device measures the elevation of the anterior and posterior cornea by introducing a sphere or ellipse reference with a specific radius, most compatible with the individual eye as the base/reference. It then calculates the elevation relative to that reference; therefore, considered an important feature vector source. We have two types of sphere reference and toric ellipse reference. Accordingly, feature vector 4 is defined as the radius of the reference sphere/ellipse, specified by the terms BFS and BFTE located on the front elevation map. The BFS has a single value, and the BFTE has triple values. Thus, a four-cell vector is assigned. If it is BFS, its value is in the first cell, and the rest of the cells are zero. If it is BFTE, zero is in the first cell and the three corresponding values are in the next three cells, respectively, as shown in Figure 10.
After obtaining all feature vectors, one of the combination methods is concatenation, in which case the feature vectors are placed next to each other, and their length does not need to be the same; also, the order of placing them next to each other is not important. As shown in Figure 5, the feature vectors are concatenated together and form a larger feature vector before being given to the classifier. Then, this resulting feature vector is given to the classifier to determine the base curve of the lens.
The classifiers used in this study are MLP and support vector regression [SVR-regression form of support vector machine (SVM)]. The optimizer and loss used in the implementation of MLP are Adam and MSE, respectively. All activation functions in MLP layers are “ReLU” except for the activation of the last layer, which is “Linear”. The number of epochs has been defined as 100. The number of hidden layers varies in different experiments, and the number of neurons in each layer is almost halved each time. As the classification is considered a regression problem, only one neuron is structured in the output layer.
In addition to the MLP, SVR has been used as a type of classification algorithm due to its strong performance in pattern recognition [16, 36]. This algorithm uses the hyperplane to maximize the distance between the training data. The data were assigned to the closest class. In cases where linear separation of data is not possible, the algorithm uses nonlinear techniques to separate elements in the feature space [16].
In our experiments, for SVR, in each evaluation, one of the four kernels of poly, rbf, linear, and sigmoid is considered. The value of all other parameters is provided below: C = 1.0, cache_size = 200, coef0 = 0.0, degree = 3, epsilon = 0.1, gamma = “scale”, kernel = “poly”/“rbf”/“linear”/“sigmoid”, max_iter = –1, shrinking = True, tol = 0.001.
In this study, the evaluation criteria of results are the MSE and the coefficient of determination (R2). The MSE is a method of estimating the amount of error, which is the difference between the actual values and what is predicted. The closer it is to zero, the lower the error rate. Its formula is given in Equation 1.
The coefficient of determination indicates the explanatory power of the model. The coefficient of determination indicates what percentage of the dependent variable changes are explained by the independent variables. The value of this criterion is between zero and one, and if it is more than 0.6, it shows that the independent variables have been able to explain the changes in the dependent variable to a large extent. The coefficient of determination in the regression equations is denoted by R2, the formula of which is given in Equation 2. The value of this coefficient indicates the probability of correlation between the two data sets in the future.
As described in the dataset section, we used 247 data samples to perform the experiments. The data was associated with the final fitted labels through an expert’s association at Noor Eye Hospital. The number of RGP patients is limited by the nature of the corneal irregularity. Also, the labeling process is time-consuming and difficult, which is done by experts. Despite the minimal dataset, we achieved better results.
In this section, the results of the evaluations are presented. In our first experiment which the results are given in Table 3, the images [elevation (front) named map2] are resized to 88 × 88 × 3, then, inspired by the MNIST CAE model, are passed through a CAE to extract the features based on the bottleneck layer of the network. The number of epochs in the CAE in this experiment was 20, which is the best number of epochs according to our various numbers of experiments. At a higher number of epochs, the CAE tries to pay much attention to details while not important, and the most important aspect is the distinction between color boundaries, which is typically achieved with fewer epochs. The number of color codes is five, as given in Figure 6. The number of parameters of the front cornea is 10 in all experiments.
Results of map2 with a size of 88 × 88 × 3 without any preprocessing on maps and using the MNIST CAE architecture.
| Number | Maps | Input size | Features | No. of features | Preprocess | MSE | R2 |
|---|---|---|---|---|---|---|---|
| 1 | 2 | 88 × 88 × 3 | img (map2) | 11,616 | no | 0.016 | 0.5 |
| 2 | 2 | 88 × 88 × 3 | area | 5 | no | 0.014 | 0.15 |
| 3 | 2 | - | digit | 10 | - | 0.011 | 0.186 |
| 4 | - | 88 × 88 × 3 | digit + area | 10 + 5 | no | 0.011 | 0.216 |
The bolded numbers in the table indicate the best results. CAE: convolutional autoencoder; MSE: mean squared error.
In Table 3 and the other given results in this section, we refer to the Pentacam maps as “img”. They have been processed as inputs to the CAE. The features have been extracted in the bottleneck layer of CAE (feature vector 1). “Area” refers to the color area ratio on the associated Pentacam map, and “digit” refers to front cornea parameters on Pentacam images.
In this experiment, no preprocessing has been performed on the images (in Table 3, identified in map2) besides resizing. As mentioned before in Feature vector 2: the ratio of color area, we discussed why map2 is important. The number of features obtained from MNIST CAE is 11,616, and the best result of Table 3 provides a coefficient of determination value of 0.5. In the fifth row, combinations of digit and area features are also presented to a basic AutoEncoder to obtain a fused set of features for the classifier, but results show a negative coefficient of determination.
In the second experiment, to decrease the number of features of the bottleneck of CAE (i.e., 11,616), the images (map2) are resized to 32 × 32 pixels, resulting in 48 features. The model of CAE is also based on the MNIST CAE model with 100 epochs. In this case, the specified number of color codes is seven, as given in Figure 8. The results of the combination of all features of img (map2), area, and digit are provided in Table 4. This experiment has resulted in an R-squared of 0.318 based on the feature reduction of maps to 32 × 32 × 3 pixels. The previous experiment with a size of 88 × 88 × 3 had better results.
Results of map2 with a size of 32 × 32 × 3 and 48 features.
| Number | Maps | Input size | Features | No. of features | Preprocess | MSE | R2 |
|---|---|---|---|---|---|---|---|
| 1 | 2 | 32 × 32 × 3 | img (map2) | 48 (4 × 4 × 3) | no | 0.019 | 0.184 |
| 2 | 2 | 32 × 32 × 3 | area | 7 | no | 0.012 | 0.262 |
| 3 | - | - | digit | 10 | - | 0.011 | 0.315 |
| 4 | 2 | 32 × 32 × 3 | area + digit | 19 | no | 0.011 | 0.318 |
| 6 | 2 | 32 × 32 × 3 | area + img2 | 55 | no | 0.013 | 0.169 |
| 7 | 2 | 32 × 32 × 3 | digit + img2 | 60 | no | 0.011 | 0.303 |
| 8 | 2 | 32 × 32 × 3 | area + digit + img2 | 67 | no | 0.012 | 0.219 |
The bolded numbers in the table indicate the best results. MSE: mean squared error.
To decrease the number of features of the CAE bottleneck layer, in the third experiment, the CAE structure has been modified to the proposed architecture shown in Figure 7, and the number of middle-layer features is reduced to 12. In this case, all four maps are utilized based on a CAE with 20 epochs and batch size one. This experiment also evaluates the effects of using preprocessing techniques. The results associated with both preprocessed and non-preprocessed data are presented for comparison in associated rows in Table 5.
Results of the proposed CAE architecture and the effect of the preprocessing module on images to extract features and calculate color areas.
| Number | Maps | Input size | Features | No. of features | Preprocess | MSE | R2 |
|---|---|---|---|---|---|---|---|
| 1 | 1, 2, 3, 4 | 81 × 81 × 12 | img (all maps) | 12 (1 × 1 × 12) | Yes | 0.018 | 0.267 |
| 2 | 2 | 81 × 81 × 3 | area | 7 | Yes | 0.024 | 0.023 |
| No | 0.012 | 0.262 | |||||
| 3 | - | - | digit | 10 | - | 0.011 | 0.315 |
| 4 | 2 | 81 × 81 × 3 | area + digit | 19 (7 + 10) | Yes | 0.007 | 0.699 |
| No | 0.011 | 0.318 | |||||
| 5 | 1, 2, 3, 4 | 81 × 81 × 12 | area + img | 19 (7 + 12) | Yes | 0.017 | 0.273 |
| No | 0.02 | 0.167 | |||||
| 6 | 1, 2, 3, 4 | 81 × 81 × 12 | digit + img | 22 (10 + 12) | Yes | 0.008 | 0.669 |
| 7 | 1, 2, 3, 4 | 81 × 81 × 12 | area + digit + img | 29 (7 + 10 + 12) | Yes | 0.009 | 0.639 |
| No | 0.008 | 0.646 |
The bolded numbers in the table indicate the best results. CAE: convolutional autoencoder; MSE: mean squared error.
The results of all combinations of all features are presented in Table 5. The best result for this experiment is an MSE of 0.007 and a coefficient of determination of 0.699, which is much better than the previous results. And shows that using the proposed CAE model and applying the preprocessing module on images has achieved the best result so far.
In the fourth experiment, 467 unlabeled data points are used in addition to the labeled data in the unsupervised training of the CAE neural network. However, no improvement is observed in the results of this experiment. The best result provided in this experiment is an MSE of 0.008 and a coefficient of determination of 0.648. The results are provided in Table 6.
The result of the proposed CAE model.
| Number | Features | MLP | SVR | ||||||
|---|---|---|---|---|---|---|---|---|---|
| Kernel = poly | Kernel = rbf | Kernel = linear | |||||||
| MSE | R2 | MSE | R2 | MSE | R2 | MSE | R2 | ||
| 1 | CAE (img) | 0.011 | 0.521 | 0.020 | 0.183 | 0.015 | 0.381 | 0.017 | 0.308 |
| 2 | digit | - | - | 0.010 | 0.584 | 0.010 | 0.554 | 0.013 | 0.447 |
| 3 | area + digit | 0.010 | 0.561 | 0.011 | 0.532 | 0.015 | 0.373 | 0.015 | 0.359 |
| 4 | area + img | 0.011 | 0.519 | 0.011 | 0.535 | 0.014 | 0.428 | 0.016 | 0.320 |
| 5 | digit + img | 0.012 | 0.504 | 0.017 | 0.290 | 0.014 | 0.412 | 0.012 | 0.510 |
| 6 | area + digit + img | 0.008 | 0.648 | 0.009 | 0.617 | 0.014 | 0.408 | 0.013 | 0.467 |
| 7 | BFS/BFTE + area + digit + img | 0.005 | 0.785 | 0.008 | 0.641 | 0.012 | 0.477 | 0.009 | 0.606 |
The size of 88 × 88 × 12, and applying the preprocessing module on maps of CAE and color ratio calculations, and also the use of unlabeled data in unsupervised CAE training, using sphere and ellipse radius as feature vector 4. The best results are presented in bold. BFS: best-fit sphere; BFTE: best-fit toric ellipsoid; CAE: convolutional autoencoder; MLP: multi-layered perceptron; MSE: mean squared error; SVR: support vector regression.
In addition to unlabeled data, a combination of feature vector 4 (sphere/ellipse radius) with other feature vectors is used and given as input to the multi-layer perceptron and SVM classifier. The SVR is a type of SVM that enables the application of SVM to data in regression-based classifiers. The SVR was tested with four distinctive kernels, available in Table 6. Table 6 provides a comparative view of both classifiers regarding the combinatory fusion of feature vector 4 with other features based on 40 epochs. The sigmoid kernel provides an unsatisfactory result, whilst the poly kernel leads us to the least MSE (0.008) and a coefficient of determination of 0.641. However, the MLP outperforms the SVR classifier with an MSE of 0.005 and an R-squared of 0.785.
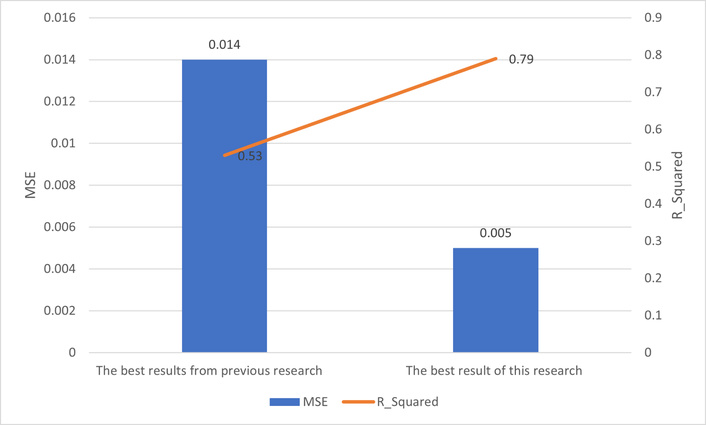
Figure 11 presents an overview of the best results of several different methods proposed and experimented with within this research, based on mean squares and the coefficient of determination. The best result of this study is an MSE of 0.005 and a coefficient of determination of 79%.
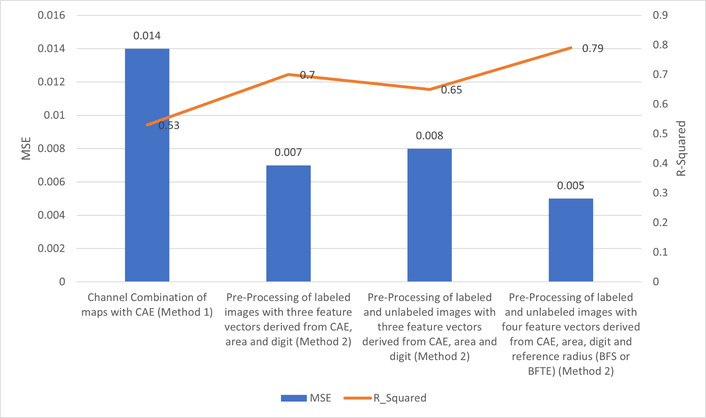
Comparison diagram of mean squares error and coefficient of determination of the best results of different methods of this research. CAE: convolutional autoencoder; MSE: mean squared error.
The best result from previous work [4–7] was the MSE of 0.014 and the coefficient of determination of 0.53, which is related to research [7]. In [7], a method of feature fusion with an autoencoder was applied to Pentacam maps, and a feature vector was extracted from the bottleneck of CAE and was passed through an MLP to determine the base-curve of RGP lenses.
Figure 12 shows a comparative chart of the best result of this research and the best result of previous research in the intersection of image-processing/machine learning and RGP lens base-curve detection [4–7].
In this paper, an automatic determination of the base curve of the RGP lens from Pentacam images is proposed to assist ophthalmologists and lens fitting experts as a medical decision support system. To this end, we have focused on minimal invasion to the eye, which is considered important for the health of each subject. Different experiments have been performed through different methodologies to determine the RGP lens base curve.
In this study, the main focus was on fusing multi-modal features. To achieve this goal, various experiments were conducted. As shown in the Results section, the highest performance achieved an MSE of 0.005 and an R-squared value of 0.79. Figure 13 presents a graph comparing the actual and predicted base-curve values on the test data.
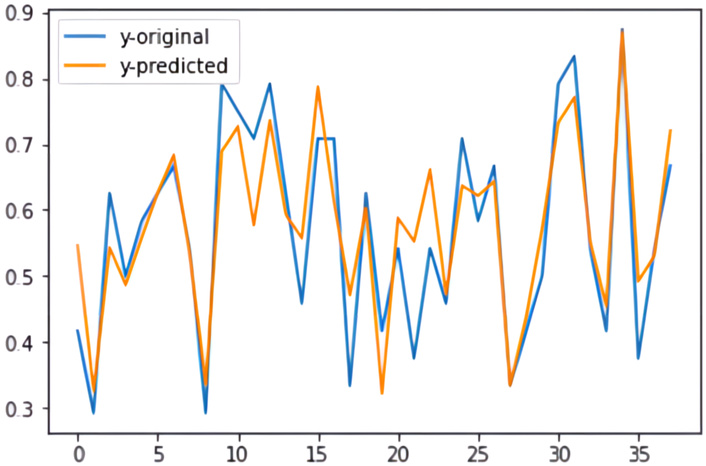
Graph comparing the actual and the predicted base-curve values for the test samples (with a mean squared error of 0.005 and a coefficient of determination of 79%).
We attribute this result primarily to the effective pre-processing techniques applied to both image maps for feature extraction from the proposed CAE bottleneck (feature vector 1), area calculation (feature vector 2), extraction of front cornea parameters (feature vector 3), and addition of sphere/ellipse radius of floating references (feature vector 4). These feature vectors were then combined using a serial fusion technique to determine the base curve. The final base curve was predicted by passing the combined feature vector through a regression-based classifier, where the MLP achieved the highest coefficient of determination and the lowest MSE.
As future work of this research, we recommend transfer learning techniques and the use of pre-trained networks to improve the CAE models. Besides this, an increased number of samples in the real data is one of the most effective issues in the medical field, as neural networks have been shown to progress with higher sample sizes. Although we have evaluated several data augmentation techniques, such as rotation and flipping, to increase the number of samples in our dataset, they did not result in better performance in our experiments.
In this study, we developed an AI-based approach to determine the base curve of RGP lenses for patients with irregular astigmatism and keratoconus using Pentacam images. The model accurately predicted base curve values, supporting clinical lens fitting.
Compared with previous RGP fitting studies, our findings show similar trends regarding the influence of corneal shape and irregularities on lens selection. Unlike traditional approaches, we relied solely on objective corneal measurements rather than patient demographics or clinical profiles.
Strengths of this study include the use of standardized RGP fittings, a labeled and consistent dataset, and multiple corneal maps (axial, elevation, and thickness) for prediction, enhancing both internal validity and clinical relevance. Limitations include the focus on a single lens design and fixed diameter, which may reduce generalizability to other lens geometries. Visual function outcomes were not incorporated, as the model focused on achieving optimal fitting.
Model interpretability remains a crucial aspect for the adoption of AI tools in clinical practice. Although a formal explainability analysis (e.g., SHAP, LIME, or feature ablation) was not performed in this study, we qualitatively observed that corneal curvature and elevation maps had the greatest influence on the base-curve prediction. Future work will include detailed interpretability analyses to enhance transparency and clinical confidence in the proposed model.
Future work could expand the dataset to include different lens designs, integrate visual function data, and explore personalized fitting strategies across various stages of keratoconus and corneal irregularities.
It is important to emphasize that the base curve values predicted by the AI model are intended as a starting point for clinical evaluation. In challenging cases, such as advanced keratoconus or highly irregular corneas, clinicians may need to consider alternative lens designs, including scleral lenses, to achieve optimal fit and visual outcomes. The AI system is designed to assist, not replace, expert clinical judgment.
The predicted base curve should be considered as an initial guideline for RGP lens fitting. Minor adjustments by clinicians may be necessary to achieve the optimal fit. Clinical judgment remains essential, and future studies will include quantitative evaluation of prediction errors and visual agreement metrics to better inform clinical practice.
Future studies will incorporate statistical significance testing, confidence interval estimation, and sensitivity analyses to provide deeper insight into model reliability and strengthen the robustness of the findings.
We focused on MSE and R2 to maintain consistency with prior studies and facilitate comparison, but incorporating additional metrics such as MAE and Bland-Altman analyses in future work could provide a more complete evaluation of clinical applicability.
This study did not include external datasets from other clinical centers due to institutional and privacy constraints, which may limit the generalizability of the results. To address this, we reserved a completely independent test set and applied regularization and early stopping to reduce overfitting. Future studies should use multi-center datasets to further confirm the model’s robustness.
Due to time constraints, advanced model interpretability analyses such as SHAP, LIME, and ablation studies were not performed in this study, but are planned for future work to improve clinical trust and understanding of the model.
BFE: best-fit ellipsoid
BFS: best-fit sphere
BFTE: best-fit toric ellipsoid
CAE: convolutional autoencoder
CCA: canonical correlation analysis
CNN: convolutional neural network
MLP: multi-layered perceptron
MSE: mean squared error
RGP: rigid gas permeable
SVM: support vector machine
SVR: support vector regression
LE: Methodology, Software, Validation, Formal analysis, Data curation, Writing—original draft, Visualization. HV: Conceptualization, Methodology, Validation, Formal analysis, Investigation, Resources, Writing—review & editing, Visualization, Supervision, Project administration. EJ: Investigation, Resources, Writing—review & editing. SH: Software, Investigation, Resources, Data curation, Writing—review & editing, Visualization. All authors reviewed the results and approved the final version of the manuscript.
The authors declare that there is no conflict of interest regarding the publication of this manuscript.
The study was approved by the Ethical Committee of University of Tehran of Medical Sciences. No specific approval number was assigned to this study. All procedures were conducted in accordance with the ethical standards of the institutional and national research committee and with the principles of the Declaration of Helsinki.
Informed consent to participate in the study was obtained from all participants.
The authors affirm that human research participants provided informed consent to publication for using their data in this research project.
The datasets generated and analyzed during the current study are not publicly available due to confidentiality and restrictions on data sharing. Requests for access to these datasets can be directed to [Ebrahim Jafarzadepour, jafarzadehpour.e@iums.ac.ir].
This research received no specific grant from any funding agency in the public, commercial, or not-for-profit sectors.
© The Author(s) 2025.
Open Exploration maintains a neutral stance on jurisdictional claims in published institutional affiliations and maps. All opinions expressed in this article are the personal views of the author(s) and do not represent the stance of the editorial team or the publisher.
Copyright: © The Author(s) 2025. This is an Open Access article licensed under a Creative Commons Attribution 4.0 International License (https://creativecommons.org/licenses/by/4.0/), which permits unrestricted use, sharing, adaptation, distribution and reproduction in any medium or format, for any purpose, even commercially, as long as you give appropriate credit to the original author(s) and the source, provide a link to the Creative Commons license, and indicate if changes were made.

View: 1806
Download: 123
Times Cited: 0
Paolo Dell’Aversana
Marco Mameli ... Iulian Gabriel Coltea
Thenuka Dharmaseelan ... Nikolas Pontikos