Original Article


Affiliation:
1Department of Gastroenterology, Sanming First Hospital Affiliated to Fujian Medical University, Sanming 365000, Fujian, China
†These authors contributed equally to this work.
ORCID: https://orcid.org/0009-0007-3496-056X

 ,
,
Affiliation:
2Department of Endoscopy Room, Sanming First Hospital Affiliated to Fujian Medical University, Sanming 365000, Fujian, China
†These authors contributed equally to this work.
ORCID: https://orcid.org/0009-0009-6060-4416
,
Affiliation:
1Department of Gastroenterology, Sanming First Hospital Affiliated to Fujian Medical University, Sanming 365000, Fujian, China
Email: smyyldping@139.com
ORCID: https://orcid.org/0009-0000-3148-1474
 ,
,
Affiliation:
1Department of Gastroenterology, Sanming First Hospital Affiliated to Fujian Medical University, Sanming 365000, Fujian, China
Email: smchb2008@qq.com
ORCID: https://orcid.org/0000-0002-8956-6814
Explor Dig Dis. 2026;5:1005123 DOI: https://doi.org/10.37349/edd.2026.1005123
Received: February 25, 2026 Accepted: April 14, 2026 Published: May 22, 2026
Academic Editor: Nahum Méndez-Sánchez, National Autonomous University of Mexico, Mexico
Aim: Recent studies suggest an association between sleep patterns and metabolic dysfunction-associated steatotic liver disease (MASLD) among American adults. Despite established sex-specific disparities in MASLD prevalence, the potential influence of sex on the sleep-MASLD relationship is not well defined. Our research aims to elucidate the sex-specific associations of sleep with MASLD by utilizing a nationally representative cohort from the United States.
Methods: Data from United States adults aged 20 and older in the 2017–2020 NHANES were analyzed in this cross-sectional study. Sleep parameters were assessed via interviewer-administered questionnaires, while MASLD was defined using vibration-controlled transient elastography (VCTE). Sex-specific associations were investigated with sex-stratified multivariable logistic regression models, and their robustness was tested through subgroup and sensitivity analyses.
Results: This study included 5,243 participants (51.2% female). A significant association was observed between sleep disorders and a greater likelihood of MASLD among male participants (OR = 1.50; 95% CI: 1.08–2.10). After full adjustment for covariates, the association remained significant in females (OR = 1.51; 95% CI: 1.06–2.16). Conversely, high sleep debt remained significantly associated with MASLD in both sexes (males: OR = 1.64; 95% CI: 1.14–2.37; females: OR = 1.51; 95% CI: 1.06–2.15). Subgroup analyses confirmed that sex did not modify these relationships.
Conclusions: Sleep disorders and sleep debt were significantly associated with MASLD in both sexes. These findings suggest that sleep health may represent an important modifiable target in MASLD prevention strategies.
The diagnosis of nonalcoholic fatty liver disease (NAFLD) requires that hepatic steatosis (microscopically evident lipid deposits in ≥ 5% of hepatocytes) be present without evidence of significant alcohol use or other causes of chronic liver disease [1]. NAFLD spans a spectrum from mild fatty liver to advanced stages involving inflammation and scarring, known as nonalcoholic steatohepatitis (NASH), with some cases developing into cirrhosis or liver cancer [2]. Recently, leading global hepatology organizations recommended that NAFLD be renamed metabolic dysfunction-associated steatotic liver disease (MASLD) [3, 4]. This revised terminology for fatty liver disease better captures the widespread occurrence of the condition and highlights the metabolic disturbances that are key to the disease’s pathogenesis. MASLD is a serious threat to human health, affecting an estimated 38% of adults worldwide [5]. Epidemiological studies consistently report a higher disease burden in men, a disparity linked to a higher prevalence of obesity and metabolic risk factors in male populations, as observed in the United States and East Asia [6, 7]. Notably, robust clinical data indicate that MASLD is associated with an elevated risk of developing various extrahepatic conditions, including cardiovascular disease (CVD) and non-liver cancers, potentially leading to increased mortality [1]. Hence, it is anticipated that MASLD and its attendant complications will represent a considerable challenge to both economic progress and public health.
Sleep is a dynamic physiological state essential for health; its dysregulation is now considered an emerging driver in the pathogenesis of chronic liver disease [8]. Growing research is focusing on the link between sleep factors or sleep patterns and MASLD. Nevertheless, the overall impact of sleep on MASLD risk remains contested. Studies reveal a U-shaped curve linking nocturnal sleep duration to MASLD risk. This pattern reflects an elevated risk at both extremes of the sleep duration spectrum: a 21% greater prevalence with < 6 hours and a 38% greater prevalence with > 8 hours [8]. Conversely, other studies with a cross-sectional design have reported no meaningful association linking sleep duration to MASLD [9]. Specific sleep disturbances, such as frequent snoring, independently predict MASLD [odds ratio (OR) = 1.48], particularly among younger and middle-aged individuals [10]. Some researchers argue that circadian rhythm disruption, rather than sleep duration per se, may be the critical factor associated with MASLD [11]. Furthermore, the mechanistic pathways linking sleep fragmentation to MASLD-related cardiovascular complications remain undefined [12]. These associations may also vary by sex, with some data suggesting women are more susceptible to the effects of aberrant sleep duration [13], while men are more vulnerable to factors like evening chronotype and physical inactivity [14].
Owing to the paucity of conclusive evidence on how diverse sleep factors collectively influence MASLD, we therefore utilized National Health and Nutrition Examination Survey (NHANES) data to address this gap. This large, population-based, cross-sectional dataset allowed us to explore correlations between individual sleep characteristics and combined sleep profiles with MASLD prevalence in contemporary United States adults. Additionally, stratified analyses by sex were conducted to assess the consistency of these relationships across groups.
This study analyzed data from the NHANES, which is a nationally representative survey administered by the CDC’s National Center for Health Statistics (NCHS) to evaluate the health and nutrition of the United States civilian, noninstitutionalized population. Its data collection protocol combines standardized household interviews, physical examinations performed by medical professionals, and laboratory tests on collected specimens. Detailed protocols encompassing survey design, data collection methodologies, and analytical procedures are publicly accessible through the NHANES website (https://wwwn.cdc.gov/nchs/nhanes/Default.aspx). The NCHS Research Ethics Review Board granted ethical approval for the NHANES data collection protocol, and all participants provided documented informed consent prior to enrollment. As this study involved a secondary analysis of de-identified, publicly available data, it was exempt from additional institutional review board approval.
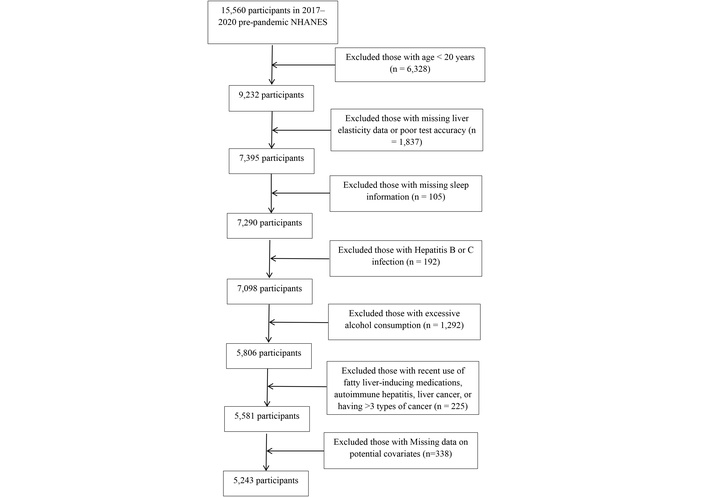
We leveraged the 2017–2020 NHANES dataset for this analysis, which initially included a cohort of 15,560 respondents. After applying the exclusion criteria sequentially, 5,243 participants remained in the final analytical sample. The exclusions were as follows: 6,328 participants aged under 20 years; 1,837 with missing or unreliable liver elasticity data; 105 with missing sleep information; 192 with hepatitis B or C infection; 1,292 with excessive alcohol consumption; 225 with recent use of hepatotoxic medications, autoimmune hepatitis, liver cancer, or more than three types of cancer; and 338 with missing data on key covariates. Figure 1 presents the flowchart of participant selection.
Hepatic steatosis was assessed in NHANES 2017–2020 using vibration-controlled transient elastography (VCTE), specifically the controlled attenuation parameter (CAP) [15]. Reliable measurements were defined by a minimum 3-hour fast, at least 10 complete stiffness assessments, and an IQR/median liver stiffness measurement (LSM) ratio of < 30%. The diagnostic threshold for hepatic steatosis was set at a CAP cutoff value of ≥ 285 dB/m [16]. To qualify for a MASLD diagnosis, participants must not meet any of the following criteria: 1) high alcohol intake (> 20 g/day [women] or > 30 g/day [men]), evaluated through dietary recalls [17, 18]; 2) active hepatitis B virus (HBV) or hepatitis C virus (HCV) infection, as per serological testing [18]; and 3) comorbid conditions such as cancer, autoimmune liver disease, or recent steatogenic drug use [19].
Sleep patterns were defined by five components: sleep duration, trouble sleeping, sleep disorders, social jet lag, and sleep debt. Sleep duration data were obtained from two survey questions: “Number of hours usually slept on weekdays or workdays” and “Number of hours usually slept on weekends or non-workdays” [20]. The mean weekly sleep duration was calculated using the formula: (weekday sleep hours × 5 + weekend sleep hours × 2)/7. Sleep duration was classified per National Sleep Foundation guidelines as short (< 7 h/d), long (≥ 9 h/d), or regular (7–9 h/d) [21]. Trouble sleeping was assessed by asking participants, “Have you ever told a doctor or other health professional that you have trouble sleeping?” [22]. Sleep disorders encompass snoring, symptoms of sleep apnea, and excessive daytime sleepiness. Using the absolute difference between free-day and mean weekly sleep duration, sleep debt was defined and categorized into low (< 2 h) or high (≥ 2 h) levels [21]. Similarly, the absolute difference in sleep midpoints on workdays versus free days was used to quantify social jet lag, a form of circadian misalignment resulting from discord between biological and social time. It was classified as mild (< 2 h) or heavy (≥ 2 h) [21]. Each of the five components was assigned a score of 1 if present and 0 otherwise. A composite score was obtained by summing these individual scores. Based on this total, sleep patterns were categorized into three groups: healthy (0), moderate (1–2), and poor (3–5) [22].
We adjusted for several potential confounders, including age, sex, race, education level, marital status, body mass index (BMI), waist circumference (WC), smoking, physical activity (PA), sedentary time, composite dietary antioxidant index (CDAI), hypertension, diabetes, dyslipidemia, CVD, and clinically relevant depression (CRD). The question measured smoking status “Have you smoked at least 100 cigarettes in your entire life?” and dichotomized as “yes” or “no” based on the responses [22]. PA was assessed using the Global Physical Activity Questionnaire (GPAQ), which captures data on daily activities, leisure-time exercise, and sedentary behavior. Total PA was calculated by summing moderate-intensity PA minutes with twice the vigorous-intensity PA minutes. Adherence to the 2018 PA Guidelines served as the criterion for categorization. Participants who achieved at least 150 minutes of moderate-intensity, 75 minutes of vigorous-intensity, or an equivalent combination per week were labeled “active”; all others were “inactive” [23]. Sedentary time was defined as the total daily sitting time, excluding sleep [22]. BMI was dichotomized into non-obese (< 30) and obese (≥ 30) categories according to CDC guidelines [24]. Participants were categorized as having abdominal obesity if their WC was ≥ 102 cm (men) or ≥ 88 cm (women); otherwise, they were classified as non-abdominal obese [25]. Dietary data in NHANES were gathered via two 24-hour recall interviews. The initial one was performed in-person at a mobile examination center (MEC), with a follow-up interview conducted telephonically 3–10 days thereafter. To minimize recall bias, antioxidant intake values represent the average of both assessments. The CDAI was computed from 24-hour dietary recalls by standardizing intakes of six dietary antioxidants [17]. Hypertension encompassed a physician’s diagnosis, antihypertensive medication use, or BP ≥ 130/80 mmHg [20, 26]. Dyslipidemia was defined as meeting at least one of the following criteria: total cholesterol ≥ 200 mg/dL, triglycerides ≥ 150 mg/dL, LDL cholesterol ≥ 130 mg/dL, HDL cholesterol < 40 mg/dL (men) or < 50 mg/dL (women), or current use of cholesterol-lowering drugs [27]. Participants were considered to have diabetes if they met any of the following conditions: a self-reported doctor’s diagnosis, laboratory evidence of dysglycemia (fasting glucose ≥ 126 mg/dL or HbA1c ≥ 6.5%), or receipt of pharmacological treatment for diabetes [27]. CVD was ascertained through self-reported physician diagnosis of conditions like coronary heart disease and stroke, or the use of cardiovascular agents [20]. The assessment of CRD was based on the Patient Health Questionnaire-9 (PHQ-9), with an established cut-off score of ≥ 10 indicating probable disorder, per Diagnostic and Statistical Manual of Mental Disorders (DSM-IV) guidelines [22].
Data are presented as mean (SD) for continuous variables and as percentage (%) for categorical variables to describe the study population. We employed t-tests for continuous variables and chi-square tests for categorical variables. This study examined the association between sleep factors/patterns (independent variables) and MASLD (dependent variable). The associations of sleep factors (including sleep duration, trouble sleeping, sleep disorders, social jet lag, and sleep debt) and overall sleep patterns with MASLD risk were evaluated using multivariable logistic regression. Model 1 adjusted for age and race. Model 2 additionally adjusted for sociodemographic and lifestyle factors, including marriage status, education, smoking, BMI, WC, PA, sedentary time, and CDAI. Model 3 further included hypertension, diabetes, dyslipidemia, CVD, and depression. ORs and 95% confidence intervals (CIs) were used to evaluate the relationship between sleep factors/patterns and MASLD. We performed sex-based subgroup analyses and sensitivity analyses to test the findings’ robustness. All analyses used R software (v4.5.1), with P < 0.05 deemed statistically significant.
Table 1 summarizes the baseline demographics of the 5,243 study participants (mean age: 50.01 years in males, 49.53 years in females), including 2,684 females. According to the CAP threshold of ≥ 285 dB/m, 1,986 individuals were identified with MASLD, yielding an overall prevalence of 37.88%. Stratified by the presence of MASLD, comparative analyses revealed several differences between groups. Participants with MASLD were significantly older and showed a different racial/ethnic distribution than those without MASLD. In sex-stratified analyses, lower educational attainment was observed among female participants with MASLD, whereas no significant education difference was found among male participants. Additionally, elevated BMI and WC, a higher proportion of males and married individuals, and increased prevalence of physical inactivity, hypertension, dyslipidemia, and diabetes were all associated with the MASLD group (Table 1). Sleep-related characteristics also differed significantly between groups. Reports of trouble sleeping, sleep disorders, sleep debt, and sleep patterns (healthy and poor) all showed notable differences between participants with and without MASLD (Table 2). Sleep duration differed significantly between female participants with and without MASLD. However, this difference was not found in male respondents (Table 2).
Baseline characteristics stratified by sex and MASLD status.
| Characteristic | Male respondents | Female respondents | ||||||
|---|---|---|---|---|---|---|---|---|
| Total (N = 2,559) | No (N = 1,482) | Yes (N = 1,077) | P value | Total (N = 2,684) | No (N = 1,775) | Yes (N = 909) | P value | |
| Age (years), mean ± SD | 50.01 ± 17.45 | 48.80 ± 18.05 | 51.67 ± 16.46 | < 0.001 | 49.53 ± 16.87 | 47.62 ± 17.54 | 53.25 ± 14.78 | < 0.001 |
| Race, N (%) | < 0.001 | < 0.001 | ||||||
| Mexican American | 307 (12.00) | 129 (8.70) | 178 (16.53) | 343 (12.78) | 173 (9.75) | 170 (18.70) | ||
| Non-Hispanic Black | 647 (25.28) | 454 (30.63) | 193 (17.92) | 725 (27.01) | 509 (28.68) | 216 (23.76) | ||
| Non-Hispanic White | 898 (35.09) | 484 (32.66) | 414 (38.44) | 896 (33.38) | 585 (32.96) | 311 (34.21) | ||
| Other Hispanic | 273 (10.67) | 151 (10.19) | 122 (11.33) | 285 (10.62) | 196 (11.04) | 89 (9.79) | ||
| Other Race | 434 (16.96) | 264 (17.81) | 170 (15.78) | 435 (16.21) | 312 (17.58) | 123 (13.53) | ||
| Education, N (%) | 0.177 | < 0.001 | ||||||
| Less than 9th grade | 199 (7.78) | 108 (7.29) | 91 (8.45) | 162 (6.04) | 91 (5.13) | 71 (7.81) | ||
| 9–11th grade | 281 (10.98) | 167 (11.27) | 114 (10.58) | 259 (9.65) | 169 (9.52) | 90 (9.90) | ||
| High school graduate/GED or equivalent | 634 (24.78) | 368 (24.83) | 266 (24.70) | 614 (22.88) | 376 (21.18) | 238 (26.18) | ||
| Some college or AA degree | 785 (30.68) | 435 (29.35) | 350 (32.50) | 961 (35.80) | 643 (36.23) | 318 (34.98) | ||
| College graduate or above | 660 (25.79) | 404 (27.26) | 256 (23.77) | 688 (25.63) | 496 (27.94) | 192 (21.12) | ||
| Marital, N (%) | < 0.001 | < 0.001 | ||||||
| Married/Living with partner | 1,656 (64.71) | 893 (60.26) | 763 (70.84) | 1,460 (54.40) | 953 (53.69) | 507 (55.78) | ||
| Never married | 504 (19.70) | 348 (23.48) | 156 (14.48) | 530 (19.75) | 391 (22.03) | 139 (15.29) | ||
| Widowed/Divorced/Separated | 399 (15.59) | 241 (16.26) | 158 (14.67) | 694 (25.86) | 431 (24.28) | 263 (28.93) | ||
| BMI (kg/m2), N (%) | < 0.001 | < 0.001 | ||||||
| < 30 | 1,569 (61.31) | 1,179 (79.55) | 390 (36.21) | 1,431 (53.32) | 1,172 (66.03) | 259 (28.49) | ||
| ≥ 30 | 990 (38.69) | 303 (20.45) | 687 (63.79) | 1,253 (46.68) | 603 (33.97) | 650 (71.51) | ||
| WC (cm), N (%) | < 0.001 | < 0.001 | ||||||
| Male < 102/Female < 88 | 1,349 (52.72) | 1,067 (72.00) | 282 (26.18) | 366 (13.64) | 359 (20.23) | 7 (0.77) | ||
| Male ≥ 102/Female ≥ 88 | 1,210 (47.28) | 415 (28.00) | 795 (73.82) | 2,318 (86.36) | 1,416 (79.77) | 902 (99.23) | ||
| Physical activity, N (%) | < 0.001 | < 0.001 | ||||||
| Active | 1,841 (71.94) | 1,112 (75.03) | 729 (67.69) | 1,530 (57.00) | 1,058 (59.61) | 472 (51.93) | ||
| Inactive | 718 (28.06) | 370 (24.97) | 348 (32.31) | 1,154 (43.00) | 717 (40.39) | 437 (48.07) | ||
| Sedentary time (hours), N (%) | < 0.001 | 0.200 | ||||||
| < 8 | 1,852 (72.37) | 1,111 (74.97) | 741 (68.80) | 1,943 (72.39) | 1,299 (73.18) | 644 (70.85) | ||
| ≥ 8 | 707 (27.63) | 371 (25.03) | 336 (31.20) | 741 (27.61) | 476 (26.82) | 265 (29.15) | ||
| Smoking status, N (%) | 0.545 | 0.037 | ||||||
| Never smoker | 1,339 (52.33) | 783 (52.83) | 556 (51.62) | 1,859 (69.26) | 1,253 (70.59) | 606 (66.67) | ||
| Current smoker | 1,220 (47.67) | 699 (47.17) | 521 (48.38) | 825 (30.74) | 522 (29.41) | 303 (33.33) | ||
| CDAI, mean ± SD | 1.48 ± 4.60 | 1.59 ± 4.85 | 1.34 ± 4.22 | 0.161 | –0.29 ± 3.60 | –0.22 ± 3.65 | –0.43 ± 3.50 | 0.153 |
| Hypertension, N (%) | < 0.001 | < 0.001 | ||||||
| No | 1,087 (42.48) | 739 (49.87) | 348 (32.31) | 1,328 (49.48) | 1,008 (56.79) | 320 (35.20) | ||
| Yes | 1,472 (57.52) | 743 (50.13) | 729 (67.69) | 1,356 (50.52) | 767 (43.21) | 589 (64.80) | ||
| Dyslipidemia, N (%) | < 0.001 | < 0.001 | ||||||
| No | 910 (35.56) | 658 (44.40) | 252 (23.40) | 882 (32.86) | 707 (39.83) | 175 (19.25) | ||
| Yes | 1,649 (64.44) | 824 (55.60) | 825 (76.60) | 1,802 (67.14) | 1,068 (60.17) | 734 (80.75) | ||
| CVD, N (%) | 0.312 | 0.052 | ||||||
| No | 2,246 (87.77) | 1,309 (88.33) | 937 (87.00) | 2,482 (92.47) | 1,654 (93.18) | 828 (91.09) | ||
| Yes | 313 (12.23) | 173 (11.67) | 140 (13.00) | 202 (7.53) | 121 (6.82) | 81 (8.91) | ||
| Diabetes, N (%) | < 0.001 | < 0.001 | ||||||
| No | 1,997 (78.04) | 1,271 (85.76) | 726 (67.41) | 2,195 (81.78) | 1,602 (90.25) | 593 (65.24) | ||
| Yes | 562 (21.96) | 211 (14.24) | 351 (32.59) | 489 (18.22) | 173 (9.75) | 316 (34.76) | ||
| CRD, N (%) | 0.110 | 0.051 | ||||||
| No | 2,399 (93.75) | 1,399 (94.40) | 1,000 (92.85) | 2,430 (90.54) | 1,621 (91.32) | 809 (89.00) | ||
| Yes | 160 (6.25) | 83 (5.60) | 77 (7.15) | 254 (9.46) | 154 (8.68) | 100 (11.00) | ||
BMI: body mass index; CDAI: composite dietary antioxidant index; CRD: clinically relevant depression; CVD: cardiovascular disease; MASLD: metabolic dysfunction-associated steatotic liver disease; WC: waist circumference.
Baseline sleep characteristics stratified by sex and MASLD status.
| Characteristic | Male respondents | Female respondents | ||||||
|---|---|---|---|---|---|---|---|---|
| Total (N = 2,559) | No (N = 1,482) | Yes (N = 1,077) | P value | Total (N = 2,684) | No (N = 1,775) | Yes (N = 909) | P value | |
| Sleep duration (hours), N (%) | 0.678 | 0.049 | ||||||
| < 7 | 726 (28.37) | 429 (28.95) | 297 (27.58) | 605 (22.54) | 375 (21.13) | 230 (25.30) | ||
| 7–9 | 1,550 (60.57) | 887 (59.85) | 663 (61.56) | 1,680 (62.59) | 1,130 (63.66) | 550 (60.51) | ||
| > 9 | 283 (11.06) | 166 (11.20) | 117 (10.86) | 399 (14.87) | 270 (15.21) | 129 (14.19) | ||
| Trouble sleeping, N (%) | < 0.001 | < 0.001 | ||||||
| No | 1,929 (75.38) | 1,165 (78.61) | 764 (70.94) | 1,887 (70.31) | 1,293 (72.85) | 594 (65.35) | ||
| Yes | 630 (24.62) | 317 (21.39) | 313 (29.06) | 797 (29.69) | 482 (27.15) | 315 (34.65) | ||
| Sleep disorders, N (%) | < 0.001 | < 0.001 | ||||||
| No | 544 (21.26) | 383 (25.84) | 161 (14.95) | 599 (22.32) | 459 (25.86) | 140 (15.40) | ||
| Yes | 2,015 (78.74) | 1,099 (74.16) | 916 (85.05) | 2,085 (77.68) | 1,316 (74.14) | 769 (84.60) | ||
| Social jet lag, N (%) | 0.712 | 0.645 | ||||||
| No | 1,986 (77.61) | 1,154 (77.87) | 832 (77.25) | 2,157 (80.37) | 1,422 (80.11) | 735 (80.86) | ||
| Yes | 573 (22.39) | 328 (22.13) | 245 (22.75) | 527 (19.63) | 353 (19.89) | 174 (19.14) | ||
| Sleep debt, N (%) | 0.022 | 0.008 | ||||||
| No | 2,247 (87.81) | 1,320 (89.07) | 927 (86.07) | 2,368 (88.23) | 1,587 (89.41) | 781 (85.92) | ||
| Yes | 312 (12.19) | 162 (10.93) | 150 (13.93) | 316 (11.77) | 188 (10.59) | 128 (14.08) | ||
| Sleep pattern, N (%) | < 0.001 | < 0.001 | ||||||
| Healthy | 227 (8.87) | 170 (11.47) | 57 (5.29) | 286 (10.66) | 215 (12.11) | 71 (7.81) | ||
| Intermediate | 1,740 (68.00) | 991 (66.87) | 749 (69.55) | 1,783 (66.43) | 1,196 (67.38) | 587 (64.58) | ||
| Poor | 592 (23.13) | 321 (21.66) | 271 (25.16) | 615 (22.91) | 364 (20.51) | 251 (27.61) | ||
We developed three multivariate regression models to examine these relationships. Model 1 adjusted for age and race; Model 2 further adjusted for some of the covariates (marriage status, education level, BMI, WC, PA, sedentary time, smoking status, and the CDAI); and Model 3 represented the fully adjusted model, incorporating all available covariates. As summarized in Figures 2 and 3, after adjusting for covariates, MASLD was significantly linked to elevated odds of sleep disorders in female respondents (OR = 1.51; 95% CI: 1.06–2.16) compared to those without MASLD. Among males, this association was attenuated in the fully adjusted model (OR = 1.50; 95% CI: 1.08–2.10). By contrast, analyses revealed a null association between MASLD and all other individual sleep metrics examined—including sleep duration, trouble sleeping, and social jet lag—as well as with the composite sleep patterns measure, in both males and females. Furthermore, an independent association was observed between high sleep debt and MASLD risk. This association was consistent in both sexes (males: OR = 1.64, 95% CI: 1.14–2.37; females: OR = 1.51, 95% CI: 1.06–2.15), pointing to a potential role of chronic sleep deprivation.
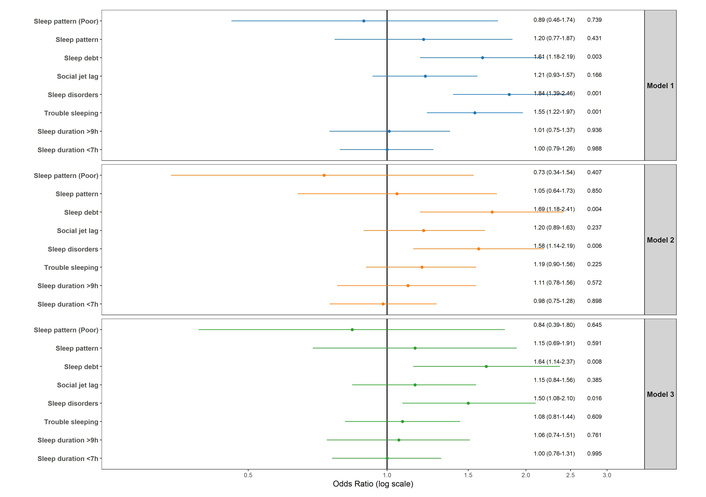
Factors associated with MASLD (CAP ≥ 285 dB/m) in male participants. Model adjustments: Model 1: adjusted for age and race; Model 2: additionally adjusted for marital status, education, smoking, BMI group, waist group, physical activity, sedentary time, CDAI; Model 3: additionally adjusted for hypertension, diabetes, dyslipidemia, CVD, and CRD. BMI: body mass index; CAP: controlled attenuation parameter; CDAI: composite dietary antioxidant index; CRD: clinically relevant depression; CVD: cardiovascular disease; MASLD: metabolic dysfunction-associated steatotic liver disease.
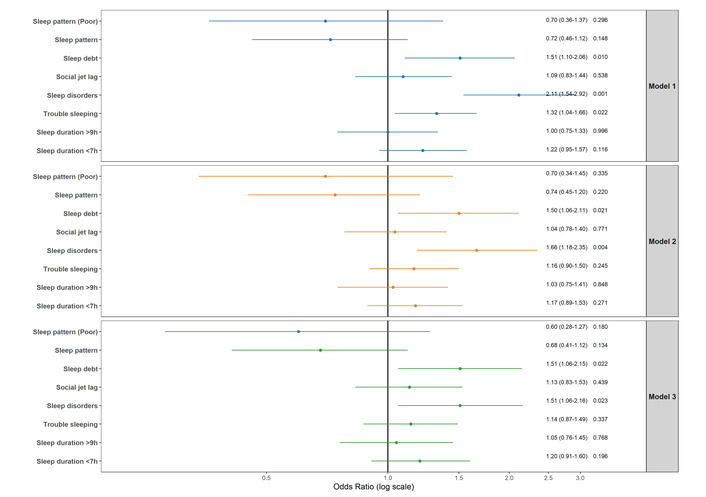
Factors associated with MASLD (CAP ≥ 285 dB/m) in female participants. Model adjustments: Model 1: adjusted for age and race; Model 2: additionally adjusted for marital status, education, smoking, BMI group, waist group, physical activity, sedentary time, CDAI; Model 3: additionally adjusted for hypertension, diabetes, dyslipidemia, CVD, and CRD. BMI: body mass index; CAP: controlled attenuation parameter; CDAI: composite dietary antioxidant index; CRD: clinically relevant depression; CVD: cardiovascular disease; MASLD: metabolic dysfunction-associated steatotic liver disease.
Effect modification was assessed through subgroup analyses based on age and BMI, dichotomized as < 65 vs. ≥ 65 years and < 30 vs. ≥ 30 kg/m2, respectively. The fully adjusted model (Model 3) demonstrated consistent associations across all subgroups. There was no statistical evidence of effect modification; all P for interaction > 0.05.
Using a cross-sectional, nationally representative cohort of United States adults, this study examined the links between sleep behaviors, sleep patterns, and MASLD. A key finding from our study was that sleep disorders (including snoring, sleep apnea, and daytime sleepiness) and sleep debt were both independently associated with an increased risk of MASLD in men and women. Other sleep-related factors, including sleep duration, trouble sleeping, social jet lag, and overall sleep patterns, were not significantly associated with MASLD risk. Sensitivity analyses revealed that age and BMI didn’t influence these effects.
The prevalence of MASLD among adults is increasing globally and will pose a considerable challenge to economic development and public health. Sleep plays a crucial role in human physiological processes, yet modern lifestyles and digital device use have significantly eroded sleep patterns, increasing the burden of sleep disorders. Device-emitted blue light alters melatonin secretion and disrupts circadian physiology, promoting metabolic dysregulation [28].
Research into MASLD is increasingly investigating the reciprocal relationship between sleep architecture and hepatic pathophysiology [21]. Nevertheless, discrepancies in the existing literature have obscured the precise nature of this relationship.
Several previous studies have found that abnormal sleep duration (≤ 6 or ≥ 8 hours) is significantly associated with an increased risk of MASLD. A study in older adults found that sleeping < 6 or > 8 hours elevated MASLD risk by 21% and 38%, respectively, identifying 7 hours as the optimal duration [8]. A cohort study reported that short sleep duration (≤ 5 hours) was associated with a 19% increased risk of NAFLD (OR = 1.45; 95% CI: 1.08–1.95) [29]. However, conclusions across studies are somewhat inconsistent: some reported a linear relationship between sleep duration and MASLD risk [30], while others described a U-shaped association [8]. Contrary to these observational reports, we observed no robust association linking sleep duration to MASLD risk. Our result aligns with the work of Ezpeleta et al. [31], whose RCT found that an alternate-day fasting and exercise intervention, despite lowering body weight and intrahepatic triglycerides, failed to enhance sleep quality, duration, or reduce apnea risk in the studied population. The absence of a significant group-by-time interaction further suggests that improvements in MASLD are not directly mediated by changes in sleep duration [31]. Discrepancies with other studies may stem from variations in population demographics (e.g., age, ethnicity) and diagnostic criteria, as well as confounding factors like BMI. The null association observed herein underscores the need for further investigation into the sleep–MASLD relationship through longitudinal and interventional studies.
In a bidirectional Mendelian randomization analysis, the majority of the 50 outcomes showed no significant evidence for assessing the potential contributory role of insomnia in MASLD development. Only specific subgroups (such as alanine aminotransferase levels) demonstrated correlations, yet overall, no consistent causal evidence was identified between insomnia and MASLD, indicating that insomnia is not an independent factor in MASLD progression [32]. Similarly, our analysis revealed no significant correlation between trouble sleeping and MASLD, adding support to the concept that insomnia may not be a direct driver of MASLD pathogenesis. In contrast, a narrative review emphasized that insomnia is a modifiable risk factor for cardiometabolic diseases—including MASLD—by influencing metabolic processes through sleep deprivation [33]. This discrepancy suggests that insomnia may influence MASLD indirectly via mechanisms like obesity or insulin resistance, as opposed to being an independent risk factor. Our results align with the perspective that trouble sleeping alone is insufficient to directly elevate MASLD risk, and any apparent association observed in other studies may be mediated by downstream metabolic alterations.
A well-established association exists between sleep disorders, particularly obstructive sleep apnea (OSA), and MASLD risk. A Chinese study reported a higher MASLD prevalence in OSA patients, with apnea-hypopnea index (AHI), oxygen desaturation index (ODI), and lowest oxygen saturation (LSaO2) all positively correlating with MASLD severity [34]. Among individuals with type 2 diabetes, 64.4% were diagnosed with both MASLD and OSA. Among those with severe OSA, the majority (91.5%) exhibited moderate-to-severe MASLD [34]. Moreover, sleep disturbances, as measured by the Pittsburgh Sleep Quality Index (PSQI), were associated with 2.38-fold higher odds of MASLD [8]. Although our findings support an observational connection linking sleep disorders to MASLD incidence, MR analysis suggested no direct causal role for genetically predicted sleep apnea on MASLD risk after BMI adjustment (OR non-significant). A weak association was observed with HDL-C levels, but OSA itself did not lead to MASLD or elevated liver enzymes, supporting the absence of a causal relationship [35]. Despite successful weight reduction in MASLD patients, interventional studies observed no concurrent decrease in OSA risk, lending support to the view that improvements in MASLD are independent of sleep disorder status [31]. The discrepancy in conclusions may stem from differences in analytical approaches, the fact that OSA and MASLD share obesity as a common etiology, and confounding factors.
Our analysis found no significant association between social jet lag and MASLD in either sex after full adjustment for covariates. However, experimental research by Zhang et al. [35] demonstrated that social jet lag disrupts the rhythmic transcription of pituitary prolactin (PRL), thereby suppressing the hepatic MAPK/cyclin D1 pathway and promoting lipid synthesis. Restoring PRL rhythm effectively alleviated social jet lag-induced fatty liver, suggesting that social jet lag may be an independent risk factor for MASLD [35]. Future research should resolve the discrepancies between observational and experimental findings and elucidate how social jet lag impacts liver health through endocrine and metabolic pathways.
Sleep debt is defined as the difference between the amount of sleep an individual obtains on free days and their average nightly sleep over the week. As a compensatory mechanism for this debt, weekend catch-up sleep (WCS) may influence an individual’s risk of developing MASLD. Studies have found that individuals with insufficient sleep on weekdays (< 7 hours) and inadequate weekend sleep compensation exhibit a significantly increased risk of hepatic steatosis. In contrast, those who slept for less than 7 hours on weekdays but more than 7 hours on weekends can effectively reduce the risk of hepatic steatosis [36]. Our study reinforces these findings by establishing a significant link from sleep debt to MASLD, supporting the role of inadequate sleep compensation in increasing MASLD risk.
Emerging evidence highlights the significance of composite sleep patterns in MASLD progression. A large prospective cohort study established a “healthy sleep score” based on five factors (early chronotype, 7–8 hours sleep duration, and absence of insomnia, snoring, or daytime sleepiness), demonstrating that favorable sleep profiles significantly lowered risks of cardiovascular events, liver disease progression, and all-cause mortality in MASLD patients [37]. Similarly, Wang et al. [18] reported that a multidimensional sleep disturbance score—incorporating sleep duration, snoring, and daytime sleepiness—was positively correlated with MASLD risk. The same study further revealed a nonlinear association between sleep duration and MASLD, where risk was minimized within the range of 7.5 to 9.5 hours daily [18]. Additionally, among individuals with MASLD, suboptimal sleep patterns amplified fibrosis risk; conversely, a higher fiber intake (≥ 15 g/day) demonstrated a protective, modifying effect [20]. These reported associations are not fully aligned with our results, a discrepancy potentially attributable to variations in sleep metric definitions and residual confounding. For instance, prolonged sleep may be a manifestation of underlying conditions—such as sleep apnea or depression—rather than a cause. These disorders are themselves risk factors for MASLD, and if not fully adjusted for in statistical models, may appear as an independent risk associated with long sleep duration.
Our subgroup analysis revealed no sex-based differences. The adverse effects of sleep disorders and sleep debt on MASLD are consistent across both sexes, a finding consistent with a prior Korean cross-sectional study [36]. In contrast, existing literature shows varying sex-specific associations. A Japanese study reported that women sleeping ≤ 6 hours had a 44% elevated MASLD risk (OR = 1.44, 95% CI, 1.06–1.96), with no significant association in men [38]. Conversely, another study identified strong correlations specifically in men, linking MASLD to both insomnia (OR = 1.53, 95% CI, 1.10–2.12) and snoring (OR = 2.11, 95% CI, 1.40–3.19) [39]. These inconsistent findings may be attributed to factors including hormonal fluctuations (e.g., the influence of estrogen on hepatic lipid metabolism), obesity, and differences in the age composition of the studied populations. This consistency suggested that sleep interventions for MASLD prevention should be universally applied regardless of sex.
The underlying mechanisms connecting sleep disturbances to MASLD encompass multiple pathways, including inflammatory responses, oxidative stress, disrupted lipid metabolism, impaired insulin sensitivity, and circadian rhythm disorder. Chronic intermittent hypoxia (CIH) upregulates SPP1 expression, promotes M1 macrophage polarization, and exacerbates hepatic inflammation and fibrosis [40]. Social jet lag disrupts PRL rhythm, inhibits the MAPK/cyclin D1 pathway in the liver, and enhances lipid synthesis [35]. Sleep disturbances can also activate inflammatory responses via TLR2/TLR4, interfere with insulin signaling, and promote metabolic syndrome and MASLD [41]. Furthermore, circadian rhythm disruption occurs early in MASLD and may induce neuroinflammation and liver injury [42]. Beyond the direct association between sleep disorders and MASLD, OSA may also contribute to cardiovascular risk through inflammation-related atherosclerotic pathways. Previous evidence showed that patients with mild, moderate, and severe OSA had significantly higher levels of hs-CRP, Lp-PLA2, and TNF-α than controls, and that carotid intima-media thickness as well as these inflammatory markers were highest in severe OSA, suggesting a severity-dependent inflammatory and vascular burden [43]. In addition, in obese patients with MASLD, carotid intima-media thickness was predicted by the severity of hepatic steatosis, further supporting a link between steatotic liver disease and subclinical atherosclerosis [44]. Therefore, the association between sleep disorders and MASLD may have broader cardiovascular implications.
We highlight three major merits of the current research. First, we leveraged a large, nationally representative survey to conduct a sex-stratified investigation of the sleep-MASLD link. Second, MASLD was diagnosed using the precise imaging technique of VCTE, which improves the validity of our outcomes. Third, we employed a rigorous statistical methodology featuring multivariable adjustment and subgroup analyses to ensure a comprehensive and reliable assessment. These results carry meaningful public health implications, highlighting sleep behavior as a modifiable risk factor that may inform MASLD prevention strategies. Causal relationships cannot be inferred from this analysis, as it is cross-sectional in nature. Moreover, residual confounding may persist despite multivariable adjustment. Several potentially important factors, including sleep quality, OSA severity, broader mental health status, medication use, and other unmeasured clinical characteristics, were not fully captured or were unavailable in a form suitable for our analysis; therefore, these factors may have influenced both sleep patterns and MASLD risk. In addition, sleep measures relied entirely on self-report, which is susceptible to recall and social desirability biases, and specific sleep disorder subtypes were not differentiated. Furthermore, as our cohort was restricted to American adults aged 20 years and above, the findings may not be generalizable to other populations.
We acknowledge that metabolic dysfunction associated with MASLD (e.g., systemic inflammation, insulin resistance, or obesity-related comorbidities) could theoretically disrupt sleep architecture or exacerbate sleep disorders like sleep apnea. For instance, visceral adiposity contributes to both MASLD and OSA, creating a bidirectional relationship. There is an urgent need for longitudinal cohort studies and randomized controlled trials to disentangle the temporal sequence and determine whether improving sleep hygiene can directly reduce MASLD incidence or progression in the future.
Drawing upon a nationally representative dataset of American adults, this cross-sectional analysis revealed significant links between specific sleep impairments and MASLD risk. Notably, both sleep disorders and accumulated sleep debt showed a significant association with an increased likelihood of MASLD. Conversely, no significant links were found for sleep duration, trouble sleeping, social jet lag, or overall sleep patterns in either sex. These findings highlight the need for longitudinal studies to clarify causal or bidirectional relationships between sleep behaviors and MASLD. In addition to such epidemiological work, research into genetic predispositions and underlying biological mechanisms is needed to provide a comprehensive foundation for developing targeted prevention and clinical management strategies.
AHI: apnea-hypopnea index
BMI: body mass index
CAP: controlled attenuation parameter
CDAI: composite dietary antioxidant index
CIs: confidence intervals
CRD: clinically relevant depression
CVD: cardiovascular disease
GPAQ: Global Physical Activity Questionnaire
LSM: liver stiffness measurement
MASLD: metabolic dysfunction-associated steatotic liver disease
MEC: mobile examination center
NAFLD: nonalcoholic fatty liver disease
NCHS: National Center for Health Statistics
NHANES: National Health and Nutrition Examination Survey
OR: odds ratio
OSA: obstructive sleep apnea
PA: physical activity
PRL: prolactin
VCTE: vibration-controlled transient elastography
WC: waist circumference
We sincerely thank all NHANES participants and staff for making this study possible. During the preparation of this manuscript, the authors used ChatGPT-4 only for language polishing and readability improvement. After using this tool, the authors carefully reviewed and edited the manuscript and take full responsibility for the final content.
MLC: Conceptualization, Software, Formal analysis, Visualization, Writing—original draft, Writing—review & editing. HbQ: Methodology, Validation, Writing—original draft, Writing—review & editing, Funding acquisition. DpL: Supervision, Writing—review & editing. HBC: Investigation, Supervision, Writing—review & editing. All authors read and approved the submitted version.
The authors declare that they have no conflicts of interest.
The NCHS Research Ethics Review Board approved the original NHANES data collection protocol, and all participants provided written informed consent. Because the present study was a secondary analysis of de-identified, publicly available data, additional institutional review board approval was not required.
Written informed consent was obtained from all participants in the original NHANES survey.
Not applicable.
The datasets analyzed during the current study are publicly available from the NHANES website (https://wwwn.cdc.gov/nchs/nhanes/Default.aspx). The code used in the current study is available from the corresponding author on reasonable request.
This work was supported by the Sanming Green Sprout Research Foundation. No specific grant number was assigned. The funders had no role in study design, data collection and analysis, decision to publish, or preparation of the manuscript.
© The Author(s) 2026.
Open Exploration maintains a neutral stance on jurisdictional claims in published institutional affiliations and maps. All opinions expressed in this article are the personal views of the author(s) and do not represent the stance of the editorial team or the publisher.
Copyright: © The Author(s) 2026. This is an Open Access article licensed under a Creative Commons Attribution 4.0 International License (https://creativecommons.org/licenses/by/4.0/), which permits unrestricted use, sharing, adaptation, distribution and reproduction in any medium or format, for any purpose, even commercially, as long as you give appropriate credit to the original author(s) and the source, provide a link to the Creative Commons license, and indicate if changes were made.



View: 3018
Download: 34
Times Cited: 0