Perspective

Affiliation:
1Department of Medicine, School of Medicine, Nazarbayev University, Astana 010000, Kazakhstan
Email: nurmakhan.zholshybek@nu.edu.kz
ORCID: https://orcid.org/0000-0003-2071-6949
Affiliation:
2Radiology Unit, Heart Center, University Medical Center, Astana 010000, Kazakhstan
ORCID: https://orcid.org/0000-0001-8246-4754
Explor Digit Health Technol. 2026;4:101185 DOI: https://doi.org/10.37349/edht.2026.101185
Received: September 23, 2025 Accepted: January 03, 2026 Published: February 10, 2026
Academic Editor: Robertas Damaševičius, Silesian University of Technology, Poland
Multicenter imaging studies are increasingly critical in epidemiology, yet variability across scanners, acquisition protocols, and reconstruction algorithms introduces systematic biases that threaten reproducibility and comparability of quantitative biomarkers. This paper reviews the major sources of heterogeneity in MRI, CT, and PET-CT data, highlighting their impact on epidemiologic inference, including misclassification, reduced statistical power, and compromised generalizability. We outline harmonization strategies spanning pre-acquisition standardization, phantom-based calibration, post-acquisition intensity normalization, and advanced statistical and machine learning methods such as ComBat and domain adaptation. Illustrative examples from MRI flow quantification and radiomic feature extraction demonstrate how harmonization can mitigate site effects and enable robust large-scale analyses.
The harmonization of data is becoming increasingly important in imaging research. In particular, imaging data is affected by technical variability between scanners, which complicates comparisons across imaging sites, different scanners, and time points [1]. This issue impacts widely used cross-sectional modalities like magnetic resonance imaging (MRI), diffusion tensor imaging (DTI), and computed tomography (CT), as well as derived measurements such as region of interest (ROI) volumes, regional analysis of volumes examined in normalized space maps, cortical thickness estimates, and connectome matrices. To enhance statistical power when aggregating data from multiple sources, post-processing harmonization techniques are essential for reducing unwanted variability [2].
A single-source dataset introduces the potential for institutional biases, which may affect the generalizability of the model. To address the problem, large-scale, multi-center studies were utilized, but the integration of data from diverse sources is essential for achieving robust and generalizable findings. Harmonizing and disseminating data across sites enables researchers to capture variability across populations, imaging systems, and clinical practices, thereby strengthening the study’s validity. However, this process requires a well-designed infrastructure capable of acquiring, processing, and sharing data from multiple modalities while aligning with the workflows of all participating centers [3].
The reliability of MRI-derived measurements of human cerebral cortical thickness was investigated by Han et al. [4], with a focus on the effects of field strength, scanner upgrades, and manufacturer differences. They found that the average variability was 0.15 mm for cross-scanner comparisons (Siemens/GE) and 0.17 mm for cross-field strength comparisons (1.5 T/3 T). Measurements across field strengths showed a slight bias, with cortical thickness appearing greater at 3 T [4]. In the variability assessment of volumetric data combined from five different scanners (2 General Electric Signa, 2 Siemens Symphony, and a Philips Gyroscan) at five different sites by repeating the scans of five volunteers at each of the sites using T1-only acquisitions, the two Siemens scanners exhibited a characteristic bias, overestimating white matter and underestimating gray matter compared to the other scanners. This bias, however, was not apparent when multimodal data were used [5]. The results indicated that the greatest compatibility between scanners is achieved when using equipment from the same manufacturer and maintaining image acquisition parameters as similar as possible.
Many factors can influence quantitative measurements during image acquisition. For example, the ability to select among various acquisition parameters and establish optimized protocols contributes to the diversification of positron emission tomography-CT (PET-CT) imaging techniques. Modern scanners incorporate numerous components that may affect quantitative accuracy, including 3D acquisition schemes, scintillators with intrinsic radioactivity, iterative reconstruction algorithms, CT-based attenuation correction, and scatter correction models that rely on multiple assumptions [6]. Moreover, the injected dose of [18F]Fluorodeoxyglucose may range from 300 to 700 megabecquerels, depending on scanner-specific characteristics such as the PET-CT detector material and acquisition mode [7]. These factors in acquisition may lead to research and clinical outcomes. To better understand and control such variability, long half-life PET-CT calibration phantoms are used to compare quantitative measurements across scanners, acquisition protocols, and processing methods by eliminating patient-related factors. Studies using such phantoms have demonstrated that PET-CT measurements exhibit both variance and size-dependent bias influenced by object dimensions, ROI definition, scan duration, acquisition mode, and reconstruction parameters, with appreciable biases reported even for relatively large (37 mm) objects [8, 9].
Snaith et al. [10] reported substantial variation in pelvis radiography techniques, with corresponding implications for clinical decision-making. Calls for standardization of pelvis radiographic studies have been made, and some authors have even proposed specific acquisition protocols [11]. However, there is no evidence that these protocols have been implemented in diagnostic imaging centers [10].
Reconstruction algorithms differ across manufacturers and software platforms. An et al. [12] compared two of the latest 3D modeling software packages, Syngo and Mimics, for accuracy and computational efficiency. Using CT scan images in DICOM (Digital Imaging and Communications in Medicine) format, they evaluated segmentation accuracy, anatomical measurements, cost, and computational time as benchmarks. The authors reported that Mimics outperformed Syngo in terms of semi-automated segmentation and equipment cost, whereas Syngo demonstrated superior computational efficiency [13]. Another key challenge in the reconstruction algorithm process is the potential for intensity bias in the slice data, often caused by anatomical motion relative to the imaging coils. Consequently, slices capturing the same anatomical region at different times may display varying sensitivity. Such bias field inconsistencies can introduce artifacts into the final 3D reconstruction, affecting both the clinical interpretation of critical tissue boundaries and the automated analysis of the data [14].
Beyond scanners, acquisition protocols, and processing methods, variability can also arise from the human element. Carapella et al. [15] demonstrated that standardized training of operators performing manual post-processing of cardiac MRI T1 maps improved consistency in the quantification of T1 biomarkers by reducing subjective bias. Training led to more accurate estimation of mean left ventricular myocardial T1 values and wall thickness, reduced variability in these measurements, and decreased discrepancies relative to reference standards. Moreover, patient positioning performed by technologists has also been shown to significantly influence both radiation dose and image quality in CT [16].
Lange et al. [17] aimed to assess the inter-study reproducibility of cardiac MRI cine image-based hemodynamic forces (HDF) measurements and to explore the current capabilities and limitations of this emerging deformation imaging technique. They concluded that inter-study variability could be improved through further software optimization, and emphasized the need for additional validation studies to support the broader clinical adoption of cardiac MRI-based HDF analysis [17]. Respectively, the study of 25 athletes’ cardiac MRI was analyzed by two independent observers and then re-analyzed by the same observer one week apart using HDF parameters derived from feature-tracking cardiac MRI showed a low inter- and intra-observer variability [18].
Consistency in acquisition parameters is fundamental for reducing variability across imaging sites. Harmonizing protocols involves aligning scanner settings such as tube voltage, current, slice thickness, field of view, and reconstruction kernels in CT, as well as echo time, repetition time, flip angle, and voxel size in MRI [19]. By defining and adhering to consensus protocols, multicenter studies can minimize inter-scanner variability and ensure that images are comparable across different institutions. Whenever possible, published consensus recommendations (The Quantitative Imaging Biomarkers Alliance, the American College of Radiology, and the European Association of Nuclear Medicine guidelines) should be followed to improve reproducibility and facilitate cross-study integration. In PET-CT, for instance, dedicated guidelines have been established to ensure greater consistency in recovery coefficients and the standardized uptake value measurements across different scanners [20].
Phantoms provide a reliable means to calibrate and benchmark scanner performance across centers. Regular phantom scans allow for the assessment of image quality parameters such as noise, resolution, contrast, and geometric fidelity. Using standardized, commercially available phantoms ensures comparability and enables the detection of systematic differences between scanners. Phantom-based harmonization can also help establish site-specific correction factors, thereby reducing bias in quantitative imaging biomarkers [21].
Routine quality assurance (QA) procedures are essential to maintain scanner stability over time. QA programs typically include daily, weekly, and monthly checks of scanner hardware and software, monitoring of calibration drifts, and verification of image quality metrics. In multicenter studies, establishing a centralized QA framework ensures that deviations are detected early and that corrective actions are taken promptly. This not only supports protocol adherence but also builds confidence in the reliability of data across different clinical environments [22]. Vendor-provided QA monitoring is now standard, but early ultra-high-field MRI required adapting 3 T QA procedures to address stronger magnet-gradient interactions. The introduction of higher-channel radiofrequency transmission and parallel transmission further expanded QA needs, leading to additional monitoring of phase differences, signal reflection, and coupling between radiofrequency elements [23].
Once images have been acquired, variations in intensity distributions across scanners and protocols may still compromise comparability. Intensity normalization methods, including histogram matching, z-score normalization, and bias field correction, are used to standardize image intensities while preserving underlying tissue contrasts. These approaches are particularly important in MRI, where scanner-dependent scaling differences can significantly influence quantitative metrics and subsequent analyses [24].
Differences in voxel dimensions, orientations, and slice thicknesses across imaging sites necessitate resampling and reformatting procedures. Spatial harmonization ensures that images share a common resolution and geometry, thereby facilitating multi-site pooling and analysis. Interpolation methods must be applied carefully to avoid introducing artifacts or bias, especially when quantitative biomarkers depend on spatial fidelity. Registration to standardized anatomical templates may also be employed to align data across patients and centers [25].
For advanced quantitative imaging, particularly radiomics, harmonization extends to the level of feature extraction. Variations in segmentation protocols, image preprocessing steps, and feature calculation algorithms can significantly impact feature reproducibility. Adoption of standardized feature definitions, such as those proposed by the Image Biomarker Standardization Initiative, helps ensure consistency across studies [26]. Additionally, harmonization methods such as ComBat can be applied to reduce site-specific variability in extracted features while preserving biologically relevant signals. Radiomic features are often significantly influenced by CT acquisition and reconstruction parameters, which can compromise their reproducibility. However, selecting a smaller subset of more robust features, combined with study-specific correction factors, can substantially enhance clustering reproducibility, for instance, in the analysis of metastatic liver lesions [27].
ComBat is a data-driven method, meaning that the transformations it uses to align data into a common space must be specifically estimated for each study that includes data from multiple centers or protocols. In a study evaluating whether a compensation method could correct radiomic feature variability arising from different CT protocols, the application of ComBat achieved 100% sensitivity and specificity (48 of 48 volumes of interest) and effectively eliminated scanner and protocol effects while preserving the underlying differences between texture patterns [28]. However, ComBat relies on specific assumptions, and violations of these assumptions can lead to suboptimal or even flawed harmonization [29]. Before applying ComBat, it is important to ensure that the populations being harmonized are as comparable as possible in terms of age range, demographic characteristics, sex distribution, covariate slopes, and health status. Failure to account for these factors may impair harmonization during model training and can lead to substantial errors when the model is applied to new data [30].
Fortin et al. [2] proposed the use and adaptation of five statistical harmonization methods for DTI data: global scaling, functional normalization, RAVEL, Surrogate Variable Analysis, and ComBat, with unharmonized data referred to as “raw.” Their findings demonstrated that ComBat effectively retains biological variability while eliminating unwanted site-related variation, increasing the number of voxels demonstrating site-effect reduction from 481 to 5,658 for fractional anisotropy maps, and from 23,136 to 32,203 for mean diffusivity maps [2].
Phantom-based calibration is used to determine scanner-specific acquisition and reconstruction protocols. The close agreement in contrast recovery coefficient measurements between phantom and subject data in the study of Panetta et al. [21] indicates that harmonization strategies established in phantom studies translate effectively to patient images. However, the quantitative consistency between different scanners, as reflected by the root mean squared percent difference, varies depending on the metric used for harmonization [21].
Advancements in style transfer techniques could help address variability in scanner acquisition and reconstruction parameters at the image level. Style transfer is a computer vision method that takes two images, one representing the content and the other providing the reference style, and blends them to create an output that retains the core features of the content image while adopting the artistic style of the reference. In cases where a radiomics model is unavailable for a new scanner or protocol, style transfer could be used to transform images from the new machine, making them appear as if they were captured by an existing scanner [25].
Salustri et al. [31] demonstrated that HDF parameters could serve as a step toward standardization across clinical studies and are currently applicable to routinely acquired echocardiographic or cardiac MRI, regardless of equipment brand. Existing evidence highlights the clinical value of HDF in the early detection and monitoring of cardiomyopathy and heart failure, in assessing patients with dyssynchrony, and in evaluating the athlete’s heart. Moreover, the authors note that the area under the curve (AUC) can be derived from either the HDF or hemodynamic power (HDP) curves. When computed from the HDF curve, the AUC reflects an impulse, representing a change in momentum, and when normalized by the time interval, it yields the normalized AUC (nAUC), while when calculated from the HDP curve, it corresponds to hemodynamic work [31].
Data harmonization can be conducted either retrospectively or prospectively (Figure 1). In both approaches, the first step for researchers is to identify the variables to be harmonized. This decision should be guided by the overarching goal of the harmonization effort, whether it is theory-driven (aimed at testing specific relationships among selected variables) or data-driven (focused on exploring relationships across a broader set of variables). Additionally, the availability of data and the acceptable degree of harmonization must also be taken into account [32].
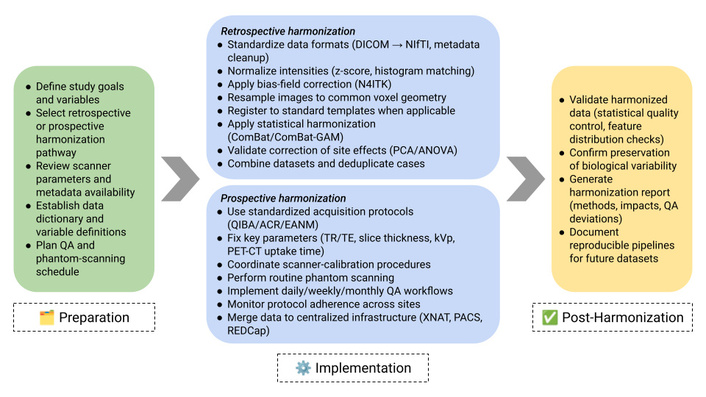
Comprehensive workflow for harmonizing multicenter quantitative imaging datasets. The process comprises three stages: (1) Preparation, in which study goals, variables, and harmonization pathways are defined; (2) Implementation, which includes retrospective and prospective harmonization procedures such as data standardization, intensity normalization, bias-field correction, spatial resampling, ComBat harmonization, protocol coordination, phantom scanning, and QA monitoring; and (3) Post-Harmonization, which focuses on data validation, assessment of preserved biological signal, and documentation of the harmonization process. This framework provides actionable methodological steps to support reproducible multicenter imaging research. QA: quality assurance; DICOM: Digital Imaging and Communications in Medicine; PET-CT: positron emission tomography-computed tomography.
Although standardization efforts have been in place for a long time and may need to be further strengthened and expanded to better include radiomics, their ability to reduce variations in radiomic feature distributions across sites is still limited [33], and the preservation of fine anatomical detail and clinically relevant predictive information is essential in medical imaging, and the downstream impacts of harmonization must be evaluated with caution [34]. The main reason is the continuing diversity of scanner models, proprietary reconstruction algorithms, and post-processing tools used in different clinical centers [33]. In particular, several key challenges were identified in developing deep learning models using multi-site structural brain MRI datasets. These challenges can be grouped into four main categories: (1) difficulty in locating relevant literature, (2) limited access to suitable datasets, (3) a widespread lack of annotation in large datasets, and (4) the need to navigate the trade-off between data harmonization and domain adaptation strategies [35].
The harmonization of multicenter imaging data is indispensable for advancing epidemiologic research. Technical heterogeneity introduced by scanner manufacturers, acquisition protocols, reconstruction algorithms, and operator-dependent factors significantly compromises the reproducibility and generalizability of imaging biomarkers. By systematically addressing these challenges through pre-acquisition standardization, phantom-based calibration, post-acquisition normalization, and statistical or machine learning methods, researchers can substantially reduce site-related variability while preserving biologically meaningful signals. The integration of harmonization workflows into study design not only strengthens causal inference and statistical power but also facilitates collaboration across institutions and populations.
Looking ahead, future directions should emphasize the development of international standards, the incorporation of radiomics and deep learning into harmonization pipelines, and the adoption of federated learning frameworks that allow data sharing without compromising privacy. These efforts will expand the reach of imaging epidemiology, enabling robust and reproducible insights into population health.
AUC: area under the curve
CT: computed tomography
DTI: diffusion tensor imaging
HDF: hemodynamic forces
HDP: hemodynamic power
MRI: magnetic resonance imaging
PET-CT: positron emission tomography-computed tomography
QA: quality assurance
ROI: region of interest
NZ: Conceptualization, Writing—original draft, Writing—review & editing. LB: Supervision, Writing—review & editing. Both authors read and approved the submitted version.
The authors declare that they have no conflicts of interest.
Not applicable.
Not applicable.
Not applicable.
Not applicable.
Not applicable.
© The Author(s) 2026.
Open Exploration maintains a neutral stance on jurisdictional claims in published institutional affiliations and maps. All opinions expressed in this article are the personal views of the author(s) and do not represent the stance of the editorial team or the publisher.
Copyright: © The Author(s) 2026. This is an Open Access article licensed under a Creative Commons Attribution 4.0 International License (https://creativecommons.org/licenses/by/4.0/), which permits unrestricted use, sharing, adaptation, distribution and reproduction in any medium or format, for any purpose, even commercially, as long as you give appropriate credit to the original author(s) and the source, provide a link to the Creative Commons license, and indicate if changes were made.