Original Article

Affiliation:
1College of Medicine and Health Sciences, Hawassa University, Hawassa P.O. Box 05, Ethiopia
Email: likkamelaku@gmail.com
ORCID: https://orcid.org/0000-0001-5650-728X
Affiliation:
2Institute of Technologies, Hawassa University, Hawassa P.O. Box 05, Ethiopia
Affiliation:
2Institute of Technologies, Hawassa University, Hawassa P.O. Box 05, Ethiopia
Affiliation:
1College of Medicine and Health Sciences, Hawassa University, Hawassa P.O. Box 05, Ethiopia
Affiliation:
2Institute of Technologies, Hawassa University, Hawassa P.O. Box 05, Ethiopia
Affiliation:
2Institute of Technologies, Hawassa University, Hawassa P.O. Box 05, Ethiopia
Affiliation:
3College of Education and Behavioral Sciences, Hawassa University, Hawassa P.O. Box 05, Ethiopia
Affiliation:
3College of Education and Behavioral Sciences, Hawassa University, Hawassa P.O. Box 05, Ethiopia
Affiliation:
4College of Business and Economics, Hawassa University, Hawassa P.O. Box 05, Ethiopia
Affiliation:
3College of Education and Behavioral Sciences, Hawassa University, Hawassa P.O. Box 05, Ethiopia
Affiliation:
2Institute of Technologies, Hawassa University, Hawassa P.O. Box 05, Ethiopia
Explor Digit Health Technol. 2025;3:101173 DOI: https://doi.org/10.37349/edht.2025.101173
Received: April 17, 2025 Accepted: September 29, 2025 Published: November 10, 2025
Academic Editor: Atanas G. Atanasov, Medical University of Vienna, Austria
Aim: To assess the burden of digital eye strain (DES) and associated factors among technology students at public universities in southern Ethiopia.
Methods: A cross-sectional study was conducted from March to April 2024 at three universities—Hawassa, Dilla, and Jinka. Data were collected using pretested self-administered questionnaires, including the Digital Eye Strain Questionnaire and other relevant variables.
Results: The survey tool was distributed to the total study population of 788 students, of whom 403 completed the survey, representing 93.5% of the calculated sample size of 431. Participants were predominantly male (74.7%) and enrolled at Hawassa University (57.8%). Daily digital device usage of ≥ 2 hours was reported by 259 (64.3%), and 72.7% had owned digital devices for > 2 years. Few participants reported smoking (0.7%), alcohol use (10.9%), or khat chewing (7.7%), and 13.9% had a history of accidents. Overall, 68.5% [95% confidence interval (CI): 64.0%–73.0%] experienced at least one symptom of DES in the past 12 months, with photophobia being the most common. DES was experienced more likely among students from Hawassa University [adjusted odds ratio (AOR) = 2.43; 95% CI: 1.11–5.30; p = 0.026], females (AOR = 2.32; 95% CI: 1.25–4.31; p = 0.008), current alcohol consumers (AOR = 3.12; 95% CI: 1.20–8.08; p = 0.019), and those with a history of accidents (AOR = 2.68; 95% CI: 1.17–6.13; p = 0.020).
Conclusions: Over two-thirds of final-year technology students in southern Ethiopian universities reported at least one symptom of DES, with higher risk observed among females, alcohol users, and those with prior accidents.
The integration of information and communication technology (ICT) into academic environments at a rapid pace has transformed education at higher institutions. Although using ICT devices by higher institution students improves teaching and learning, excessive exposure to the devices has led to a rise in visual discomfort and related health issues, particularly leading to digital eye strain (DES) [1, 2]. DES, also known as computer vision syndrome (CVS)—a range of visual symptoms arising from prolonged digital device use—includes blurred vision, eye fatigue, headaches, and dry eyes. These ocular symptoms are often accompanied by non-ocular issues such as general fatigue, headache, and neck pain, which further exacerbate DES-associated discomfort [1, 3].
Dry eye strain can lead to long-term ocular problems, including persistent discomfort and potential damage to the eyes. Prolonged screen use reduces blink rates, which may contribute to chronic dry eye syndrome [1]. In addition, exposure to blue light from digital devices may adversely affect retinal health, raising concerns about its role in conditions such as age-related macular degeneration [4, 5].
Studies from Ethiopia [6–14] and elsewhere [15–17] have examined the prevalence, associated factors, and common symptoms of DES, also known as CVS. Across these studies, the prevalence of DES or CVS was consistently high, ranging from 64.4% to 84.4%, which underscores its widespread nature. Frequently reported symptoms included blurred vision, eye strain, irritation or burning sensations, headaches, neck and shoulder pain, periorbital discomfort, and ocular redness [6, 7, 10, 11, 13, 14, 16].
Several factors have been identified as being associated with DES. Demographic characteristics, including gender and age [7, 12, 14, 17], have been shown to affect susceptibility, with certain groups at higher risk. Occupational and work-related factors, including the type of occupation [6, 17], the frequency and duration of daily computer or digital device use [6, 7, 9, 15, 17], and the sources and intensity of workplace lighting [10], also play a significant role. Environmental contributors, such as the presence of glare on screens [14, 15], can exacerbate visual discomfort. Preexisting eye conditions have also been associated with a higher likelihood of DES [6, 17]. Behavioral and preventive practices, including taking regular breaks, using eye drops [9], engaging in frequent voluntary blinking [10], and using computer-specific eyeglasses [10, 11, 13], have been reported to mitigate the risk. Additionally, socioeconomic factors, such as monthly income [10], may indirectly affect DES by influencing access to eye care, ergonomics, and preventive measures.
The studies on the prevalence of CVS and its associated factors encompassed a broad range of source populations. These populations included undergraduate students [15, 16], data clerks and secretaries [8], bank employees [11–13], post-graduate students [14], academic staff at higher education institutions [7, 9], office computer users [17], and other government employees [6, 10]. In addition, a systematic review of evidence showed the pooled prevalence of CVS among digital tool users in Ethiopia was 73.2%. The common symptoms identified in the pooled evidence were blurred vision and eye strain [18].
However, the extent of DES among final-year undergraduate technology students in Ethiopian higher education institutions remains unknown. This group is of particular interest because they tend to use digital devices more frequently and for longer durations than many other groups, both for academic activities and social interactions. Consequently, they are exposed to prolonged screen time and light emissions from electronic devices, which may place them at greater risk of developing DES. Therefore, the current study aims to assess the prevalence of DES and identify associated factors among technology students who own digital devices in selected universities in southern Ethiopia.
An institution-based cross-sectional study was conducted to determine the prevalence of DES among final-year undergraduate technology students and associated factors in three selected public higher education institutions in southern Ethiopia, including Hawassa, Dilla, and Jinka Universities (Figure 1), from March–April 2024.
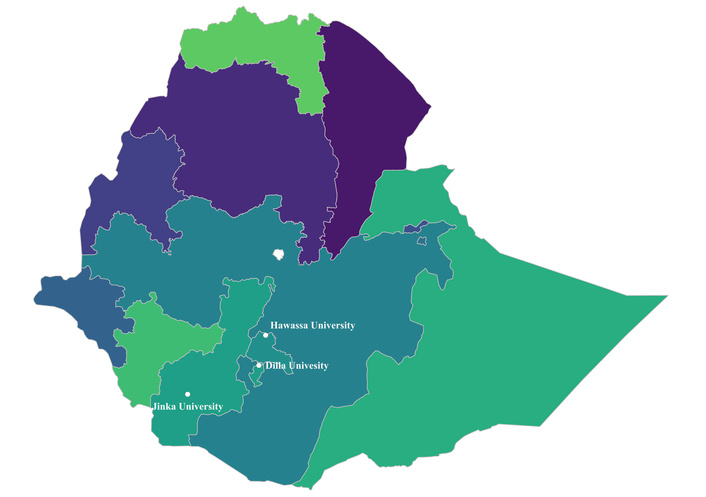
Locations of the study sites: Dilla University, Hawassa University, and Jinka University. Map created and adapted by the authors in QGIS version 3.44.2 using publicly available shapefiles of Ethiopia—Subnational Administrative Boundaries. Shapefile source: HDX, Ethiopia—Subnational Administrative Boundaries, available from https://data.humdata.org/dataset/cod-ab-eth. Accessed on August 16, 2025. © OCHA Ethiopia. Licensed under the Creative Commons Attribution for Intergovernmental Organisations (CC BY-IGO). Coordinates of the universities were obtained from Google Maps. Available at: Hawassa University (https://maps.app.goo.gl/FtZzhS6Y2iBTkdex9), Dilla University (https://maps.app.goo.gl/XHyhbpvHWUmU8BQh9), and Jinka University (https://maps.app.goo.gl/YhcDai5Q2Qa3SPMj7), as follows: Hawassa University (7.0476°N, 38.5001°E), Dilla University (6.4318°N, 38.2891°E), and Jinka University (5.7755°N, 36.5416°E).
Source population: The source population for this study comprises all final-year undergraduate technology students enrolled in public universities in southern Ethiopia.
Study population: The study population consisted of all final-year undergraduate technology students enrolled in three randomly selected public universities in southern Ethiopia—Jinka, Dilla, and Hawassa Universities. During the study period, there were a total of 788 final-year undergraduate technology students in these universities—50 from Jinka, 300 from Dilla, and 438 from Hawassa Universities. This total of 788 students served as the study population for the study.
All final-year technology students possessing personal computers, tablets, smartphones, notebooks, e-readers, and/or iPads were eligible for inclusion in this study. However, students with pre-existing neck or shoulder pains and eye problems, including chronic conjunctivitis, eyelid disorders, or uncorrected refractive errors caused by other medical issues, were excluded from the study during data analysis [11, 13].
The sample size was calculated using OpenEpi version 3.01 (Open Source Epidemiologic Statistics for Public Health, Atlanta, GA, USA), applying the formula for a single population proportion with finite population correction [19]. The calculation was based on the following parameters: a 50% expected proportion of the specified population with DES, a design effect of 1.5, a 95% confidence level, a 5% margin of error, an expected response rate of 90%, and an adjusted finite population correction for a population size of 788. Consequently, the sample size calculated was 431.
We employed a two-stage sampling method in this study. In the first stage, three universities (Hawassa, Dilla, and Jinka) were randomly selected from the eight public universities in southern Ethiopia, namely Hawassa, Arba-Minch, Wolaita-Sodo, Dilla, Werabe, Welkite, Wachemo, and Jinka Universities. In the subsequent stage of sampling, final-year graduating technology students were selected. Data collection was conducted using a self-administered survey via Google Forms, allowing us to include the entire eligible population in the selected universities. Although a sample size calculation was performed, the Google Forms-based survey was distributed to all participants through Telegram groups at the selected universities. Supervisors at each university facilitated this process by creating Telegram groups for all final-year technology students within their respective colleges, and by communicating with the students to encourage them to complete the surveys.
The data were collected using pretested self-administered structured questionnaires comprised of the Digital Eye Strain Questionnaire (DESQ), sociodemographic, academic, digital devices use-related, and behavioral factors. The prevalence of DES was measured using a standardized DESQ tool [20], which consists of thirteen self-reported yes-no questions designed to identify DES complaints. The items are grouped into three dimensions—adaptation issues, dry eye issues, and posture issues. The adaptation issues dimension includes six items [dry eyes (frequently feeling dryness in the eyes), eye strain (frequently feeling pain or strain in the eyes), irritation or burning, red eyes (without an apparent reason), photophobia (sensitivity to bright light), and halo (notice a ring of light surrounding objects)]. The dry eye issues dimension consists of five items: blurred vision, a feeling of a foreign body in the eye (without an apparent reason), prickling sensation, watery eyes (tears without an apparent reason), and diplopia (seeing double). The third dimension, posture issues, includes two items: shoulder and/or neck pain (without an apparent reason) and headache (not related to injury or migraine).
The internal consistency and reliability of the tool were assessed using Cronbach’s alpha. Cronbach’s alpha measures the degree to which a set of items within a scale consistently assess the same construct. The values of Cronbach’s alpha range from 0 to 1, where higher values signify better internal consistency [21]. The Cronbach’s alpha of the 13 items of the DESQ tool used in this study was measured to be a coefficient of 0.82, demonstrating good reliability. Furthermore, the inter-rater reliability of the tool was examined using the intraclass correlation coefficient (ICC), resulting in an ICC of 0.809 [95% confidence interval (CI): 0.780–0.835]. This strong agreement among the respondents suggests that the questionnaire effectively and consistently measures the DES construct. As a result, the DESQ is a valid and reliable instrument for assessing self-reported DES among digital device users.
In this study, participants who reported experiencing at least one of the thirteen symptoms on the DESQ in the past 12 months were classified as having DES, whereas those who reported none of the symptoms were classified as not having DES. The presence of DES was coded as “1” and its absence as “0”. Since the DESQ has no validated diagnostic cut-off, this operational definition was determined a priori. This approach is consistent with previous studies that have classified participants as having DES if they report experiencing at least one symptom using various self-reported assessment tools [6–10, 13, 14].
The data collection instrument was prepared in English, the medium of learning and teaching at higher institutions in Ethiopia. Before administering the tool to the participants, a pre-test was conducted with 42 participants from a health science college in Hawassa who were not part of the study. The pre-test responses were analyzed for item clarity, relevance, and internal consistency, and adjustments were made to the wording of ambiguous questions before final deployment. Eventually, the questionnaire was transcribed to Google Forms for administration to the study participants. To facilitate the data collection process, three supervisors—one assigned to each respective university—were trained and assigned for oversight. After the data collectors submitted their responses to the server, all entries were promptly reviewed to ensure completeness, and any necessary immediate actions were taken. To assess the reliability of the questionnaire, Cronbach’s alpha method was employed, yielding a value of 0.82 for the 13 items, indicating good internal consistency and high reliability.
The data collected via Google Forms were exported to Statistical Package for the Social Sciences (SPSS) for Windows, version 25 (IBM Corp., Armonk, NY, USA), and R, version 4.4.2, for statistical analyses and generation of plots. Maps were produced in Quantum Geographic Information System (QGIS, version 3.44.2), and plots were created using the ggplot2 package in R. Prior to analysis, data were cleaned to ensure consistency and completeness, including removal of duplicate entries, verification of logical consistency, and exclusion of participants who did not meet the inclusion criteria. Participants diagnosed with any eye conditions or shoulder/neck pain were excluded from the analysis.
The sociodemographic, internet use, behavioral, and other characteristics of the respondents were summarized using descriptive statistics. The status and prevalence of DES were also described.
A bivariate analysis was conducted to identify potential predictors associated with DES. Independent variables with a p-value less than 0.25 in the bivariate regression with DES were considered candidates for the multiple binary logistic regression model. Additionally, multicollinearity among the independent variables was assessed using a collinearity matrix, with variables having a Pearson correlation coefficient (r) greater than or equal to 0.70 deemed as multicollinear. Finally, the multiple binary logistic regression model was constructed, assuming a significant relationship between the DES and independent variables at a p-value < 0.05. The results were reported as adjusted odds ratios (AOR) with 95% CI. The Hosmer-Lemeshow goodness-of-fit test was employed to evaluate the fit of multivariate logistic regression models. A p-value > 0.05 established the model’s goodness [22].
The survey tool was distributed to the total study population of 788 students, of whom 403 completed the survey, representing 93.5% of the calculated sample size of 431, exceeding the expected response rate of 90%. Among the participants, 301 (74.7%) were male. By university, 233 (57.8%) attended Hawassa University. Regarding their field of study, the largest group was computer engineering students (158, 39.2%), followed by civil engineering (42, 10.4%).
Most participants, 364 (90.3%), were aged 20–24 years, while 39 (9.7%) were older than 24 years. Concerning parental residence, 305 (75.7%) reported living in urban areas. Regarding academic performance, 106 (26.3%) had a grade point average (GPA) of 3.5 or above, whereas 19 (4.7%) had a GPA of 2.5 or below.
A plurality of parents was employed, including 152 (37.7%) fathers and 114 (28.3%) mothers, and had at least a certificate-level education (182, 45.2% fathers; 127, 31.5% mothers). In terms of household income, 139 participants (34.5%) reported a monthly family income of > 10,000 Ethiopian Birr (ETB), and 190 participants (47.1%) reported receiving > 1,000 ETB in monthly pocket money (Table 1).
Sociodemographic characteristics of the study participants, 2024 (n = 403).
| Characteristics | Category | Frequency (percentage*) |
|---|---|---|
| Sex | Male | 301 (74.7) |
| Female | 102 (25.3) | |
| University | Hawassa | 233 (57.8) |
| Dilla | 120 (29.8) | |
| Jinka | 50 (12.4) | |
| Field of study | Biomedical engineering | 22 (5.5) |
| Chemical engineering | 18 (4.5) | |
| Civil engineering | 42 (10.4) | |
| Computer engineering | 158 (39.2) | |
| CTM | 39 (9.7) | |
| Electrical engineering | 41 (10.2) | |
| ICT | 34 (8.4) | |
| Others | 49 (12.2) | |
| Age of the respondents (years) | 20–24 | 364 (90.3) |
| > 24 | 39 (9.7) | |
| Family residence | Urban | 305 (75.7) |
| Rural | 98 (24.3) | |
| Grade point average (GPA) | ≤ 2.5 | 19 (4.7) |
| > 2.5–3.0 | 97 (24.1) | |
| > 3.0–< 3.5 | 181 (44.9) | |
| ≥ 3.5 | 106 (26.3) | |
| Father’s occupation | Employee | 152 (37.7) |
| Farmer | 88 (21.8) | |
| Merchant | 92 (22.8) | |
| Others | 71 (17.6) | |
| Mother’s occupation | Employee | 114 (28.3) |
| Farmer | 71 (17.6) | |
| Merchant | 117 (29.0) | |
| Housewife | 15 (3.7) | |
| Others | 86 (21.3) | |
| Father’s educational level | Able to read and write | 87 (21.6) |
| Primary education | 66 (16.4) | |
| Secondary education | 68 (16.9) | |
| Certificate or above | 182 (45.2) | |
| Mother’s educational level | Able to read and write | 98 (24.3) |
| Primary education | 109 (27.0) | |
| Secondary education | 69 (17.1) | |
| Certificate or above | 127 (31.5) | |
| Monthly family income | < 1,000 ETB | 32 (7.9) |
| 1,000–3,000 ETB | 47 (11.7) | |
| 3,001–5,000 ETB | 62 (15.4) | |
| 5,001–10,000 ETB | 123 (30.5) | |
| > 10,000 ETB | 139 (34.5) | |
| Pocket money received per month | ≤ 1,000 ETB | 213 (52.9) |
| > 1,000 ETB | 190 (47.1) |
* Percentages are rounded to 1 decimal place. CTM: Construction Technology and Management; ICT: information and communication technology; ETB: Ethiopian Birr.
The study assessed participants’ digital devices and internet use characteristics, including daily internet usage time. Among them, 144 participants (35.7%) reported spending < 2 hours online each day. A significant portion, 250 participants (62.0%), indicated that they faced financial constraints when using the internet. Moreover, 293 participants (72.7%) mentioned owning digital devices (personal computers, tablets, smartphones, notebooks, e-readers, and/or iPads) for over two years (Table 2).
Digital devices ownership and internet usage characteristics of the respondents, 2024 (n = 403).
| Variables | Category | Frequency (percentage*) |
|---|---|---|
| Daily internet usage | < 2 hours | 144 (35.7) |
| ≥ 2 hours | 259 (64.3) | |
| Facing financial constraints regarding internet usage | No | 153 (38.0) |
| Yes | 250 (62.0) | |
| Duration of digital device ownership | ≤ 2 years | 110 (27.3) |
| > 2 years | 293 (72.7) |
* Percentages are rounded to 1 decimal place.
The study assessed participants’ health and lifestyle behaviors, including current body mass index (BMI), weight changes after acquiring digital devices, smoking, alcohol consumption, khat chewing, and exercise habits. The mean BMI was 20.0 ± 2.97 kg/m2. Nearly two-thirds of participants had a normal BMI (18.5–24.9 kg/m2), calculated as weight in kilograms divided by height in meters squared. Additionally, more than half of the respondents (220, 54.6%) reported weight loss after acquiring digital devices.
A small proportion of participants currently smoke (3, 0.7%), drink alcohol (44, 10.9%), or consume khat (31, 7.7%). Additionally, 208 participants (51.6%) indicated they engaged in physical exercise. Meanwhile, 99 of the respondents (24.6%) had underlying conditions unrelated to eye problems, and 56 (13.9%) had a history of accidents (Table 3).
Health and behavioral characteristics of the participants, 2024 (n = 403).
| Variables | Category | Frequency (percentage*) |
|---|---|---|
| Current BMI (kg/m2) | < 18.5 (underweight) | 118 (29.3) |
| 18.5–24.9 (normal weight) | 263 (65.3) | |
| 25–29.9 (overweight) | 19 (4.7) | |
| ≥ 30 (obese) | 3 (0.7) | |
| Weight gain/loss since owning digital devices | Lost | 220 (54.6) |
| Gained | 183 (45.4) | |
| Current smoking | No | 400 (99.3) |
| Yes | 3 (0.7) | |
| Current drinking | No | 359 (89.1) |
| Yes | 44 (10.9) | |
| Current khat consumption | No | 372 (92.3) |
| Yes | 31 (7.7) | |
| Current physical exercises | No | 195 (48.4) |
| Yes | 208 (51.6) | |
| Underlying conditions (other than eye problems) | No | 304 (75.4) |
| Yes | 99 (24.6) | |
| A history of accidents | No | 347 (86.1) |
| Yes | 56 (13.9) |
* Percentages are rounded to 1 decimal place. BMI: body mass index.
Among the respondents, 276 (68.5%) reported experiencing at least one symptom of DES within the past 12 months, either in one or both eyes. This was based on their affirmative responses to at least one of the thirteen questions on the DESQ. As a result, the prevalence of DES among final-year technology students in public higher education institutions in southern Ethiopia was found to be 68.5% (95% CI: 64.0%–73.0%). Conversely, 127 participants (31.5%) reported having none of the DES symptoms, while 3 participants (0.7%) indicated experiencing 12 out of the 13 symptoms during the same period (Table 4).
The number of dry eye symptoms experienced by the respondents within the past 12 months (n = 403).
| The number of dry eye symptoms experienced | Frequency (percentage*) | Cumulative percentage* |
|---|---|---|
| 13 | 0 (0.0) | 0.0 |
| 12 | 3 (0.7) | 0.7 |
| 11 | 4 (1.0) | 1.7 |
| 10 | 4 (1.0) | 2.7 |
| 9 | 10 (2.5) | 5.2 |
| 8 | 11 (2.7) | 7.9 |
| 7 | 14 (3.5) | 11.4 |
| 6 | 25 (6.2) | 17.6 |
| 5 | 26 (6.5) | 24.1 |
| 4 | 24 (6.0) | 30.1 |
| 3 | 45 (11.2) | 41.3 |
| 2 | 37 (9.2) | 50.5 |
| 1 | 73 (18.1) | 68.6 |
| 0 | 127 (31.5) | 100.1 |
| Total | 403 (100.0) |
* Percentages are rounded to 1 decimal place; totals may not sum exactly to 100% due to rounding.
Among the DESQ items, having photophobia (sensitivity to bright light) was the most commonly reported symptom (136 or 33.7%), followed by irritation (119 or 29.5%) (Table 5).
The DESQ items used to assess DES and their responses (n = 403).
| DESQ items (n = 403) | Yes (%) | No (%) |
|---|---|---|
| In the past 12 months: | ||
| Did you have dry eyes (frequently feeling dryness in the eye)? | 91 (22.6) | 312 (77.4) |
| Did you have eyestrain (frequently feeling pain or strain in the eyes)? | 101 (25.1) | 302 (74.9) |
| Did you have irritation or burning in your eyes? | 119 (29.5) | 284 (70.5) |
| Did you have red eyes (without apparent reason)? | 74 (18.4) | 329 (81.6) |
| Did you have photophobia (sensitivity to bright light)? | 136 (33.7) | 267 (66.3) |
| Did you have a halo (notice a ring of light surrounding objects)? | 70 (17.4) | 333 (82.6) |
| Did you have blurred vision? | 44 (10.9) | 359 (89.1) |
| Did you feel a foreign body in the eye without an apparent reason? | 36 (8.9) | 367 (91.1) |
| Did you have a prickling sensation in the eye? | 73 (18.1) | 330 (81.9) |
| Did you have watery eyes (tears) without an apparent reason? | 89 (22.1) | 314 (77.9) |
| Did you have diplopia (seeing double)? | 22 (5.5) | 381 (94.5) |
| Did you have a headache (not related to injury or migraine)? | 105 (26.1) | 298 (73.9) |
| Did you have shoulder and/or neck pain (without apparent reasons)? | 94 (23.3) | 309 (76.7) |
* Percentages are rounded to 1 decimal place. DES: digital eye strain; DESQ: Digital Eye Strain questionnaire.
In the bivariate analysis, independent variables with p-values less than 0.25 were selected as candidates for inclusion in a multiple binary logistic regression model, which aimed to identify factors associated with the occurrence of at least one self-reported symptom of DES within the previous 12 months among the participants. The variables included were the universities where participants were enrolled, participants’ sex, age, family’s residence, daily internet usage (in hours), parents’ occupations, mothers’ education level, reported monthly family income, respondents’ monthly pocket money, the BMI, alcohol consumption status, exercise habits, presence of underlying health conditions (other than those related with eye problems), and history of accidents.
To detect multicollinearity among the independent variables, a correlation matrix analysis was done. Variables with a correlation coefficient of 0.7 or above were considered multicollinear and subsequently removed. However, none of the independent variables exhibited a correlation coefficient at or above this threshold, so no variables were excluded from the analysis.
In the multivariate binary logistic regression, among the candidate independent variables, the universities from which participants were selected, sex, drinking status, and history of accidents were found to be significantly associated with DES. The remaining variables did not show a statistically significant association with DES.
The study found that students from Hawassa University were significantly more likely to report at least one symptom of DES compared to those from Jinka University (AOR = 2.43; 95% CI: 1.11–5.30; p = 0.026). In contrast, students from Dilla University did not differ significantly from Jinka University students (Figure 2, Table 6).
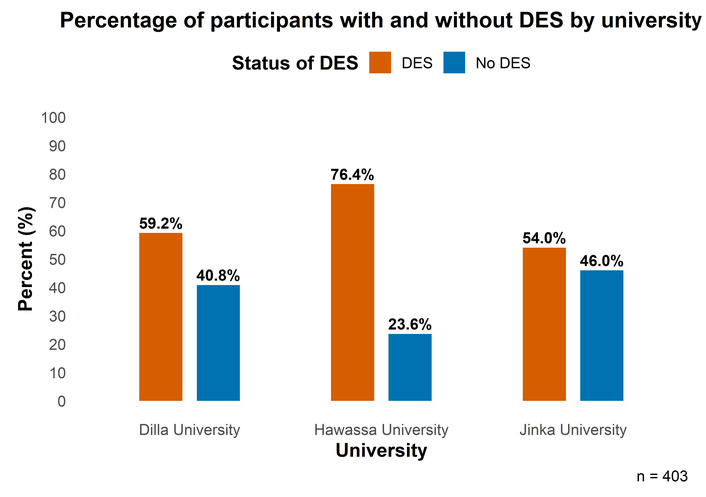
Percentage of the participants with and without DES by university. DES: dry eye symptoms.
Multivariable analysis of factors associated with DES among the study participants, 2024 (n = 403).
| Variables | DES | COR (95% CI) | AOR (95% CI) | p-value | |
|---|---|---|---|---|---|
| No (%*) | Yes (%*) | ||||
| Universities | 127 (31.5) | 276 (68.5) | 0.014** | ||
| Dilla | 49 (40.8) | 71 (59.2) | 1.23 (0.64, 2.40) | 1.18 (0.55, 2.52) | 0.680 |
| Hawassa | 55 (23.6) | 178 (76.4) | 2.76 (1.46, 5.19) | 2.43 (1.11, 5.30) | 0.026** |
| Jinka | 23 (46.0) | 27 (54.0) | 1 | 1 | |
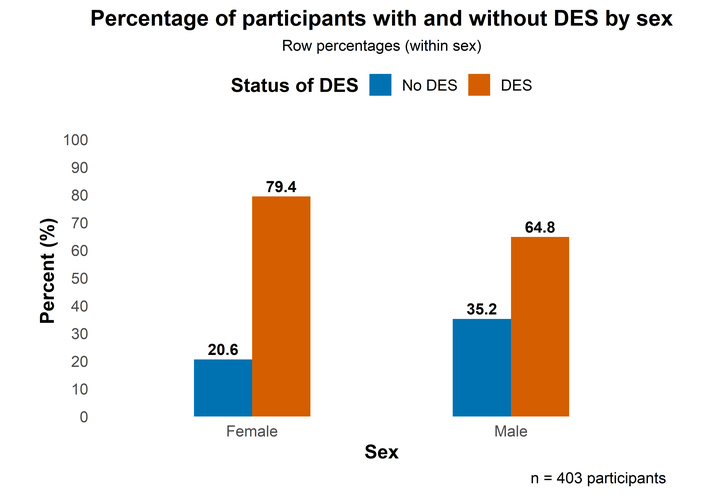
| Sex | 127 (31.5) | 276 (68.5) | 0.008** | ||
| Males | 106 (35.2) | 195 (64.8) | 1 | 1 | |
| Females | 21 (20.6) | 81 (79.4) | 2.10 (1.23, 3.58) | 2.32 (1.25, 4.31) | |
| Age | 127 (31.5) | 276 (68.5) | 0.795 | ||
| 20–24 years | 111 (30.5) | 253 (69.5) | 1.59 (0.81, 3.12) | 1.18 (0.51, 2.40) | |
| > 24 years | 16 (41.0) | 23 (59.0) | 1 | 1 | |
| Family residence | 127 (31.5) | 276 (68.5) | 0.797 | ||
| Urban | 88 (28.9) | 217 (71.1) | 0.61 (0.38, 0.99) | 1.09 (0.55, 2.16) | |
| Rural | 39 (39.8) | 59 (60.2) | 1 | 1 | |
| Time spent on the internet daily | 127 (31.5) | 276 (68.5) | 0.079 | ||
| < 2 hours | 57 (39.6) | 87 (60.4) | 1 | 1 | |
| ≥ 2 hours | 70 (27.0) | 189 (73.0) | 1.77 (1.15, 2.72) | 1.55 (0.95, 2.53) | |
| Fathers’ occupation | 127 (31.5) | 276 (68.5) | 0.480 | ||
| Employee | 40 (26.3) | 112 (73.7) | 1.23 (0.69, 2.17) | 1.34 (0.65, 2.75) | 0.427 |
| Farmer | 35 (39.8) | 53 (60.2) | 0.66 (0.36, 1.23) | 1.21 (0.45, 3.21) | 0.708 |
| Merchant | 28 (30.4) | 64 (69.6) | 1 | 1 | |
| Others | 24 (33.8) | 47 (66.2) | 0.86 (0.44, 1.66) | 0.77 (0.34, 1.76) | 0.537 |
| Mother’s occupation | 127 (31.5) | 276 (68.5) | 0.855 | ||
| Employee | 30 (26.3) | 84 (73.7) | 1.20 (0.67, 2.12) | 0.91 (0.44, 1.88) | 0.803 |
| Farmer | 30 (42.3) | 41 (57.7) | 0.58 (0.32, 1.08) | 0.84 (0.31, 2.29) | 0.739 |
| Merchant | 35 (29.9) | 82 (70.1) | 1 | 1 | |
| Others | 32 (31.7) | 69 (68.3) | 0.92 (0.52, 1.64) | 1.21 (0.60, 2.44) | 0.586 |
| Mother’s education | 127 (31.5) | 276 (68.5) | 0.964 | ||
| Unable to R&W | 37 (37.8) | 61 (62.2) | 1 | 1 | |
| Primary school | 38 (34.9) | 71 (65.1) | 1.1 (0.64, 2.00) | 1.14 (0.61, 2.14) | 0.685 |
| Secondary school | 19 (27.5) | 50 (72.5) | 1.60 (0.82, 3.11) | 1.13 (0.51, 2.50) | 0.763 |
| Certificate and above | 33 (26.0) | 94 (74.0) | 1.73 (0.98, 3.05) | 0.97 (0.43, 2.24) | 0.971 |
| Monthly family income (ETB) | 127 (31.5) | 276 (68.5) | 0.153 | ||
| ≤ 5,000 | 52 (36.9) | 89 (63.1) | 1 | 1 | |
| 5,001–10,000 | 44 (35.8) | 79 (64.2) | 1.05 (0.63, 1.74) | 0.59 (0.31, 1.13) | 0.109 |
| > 10,000 | 31 (22.3) | 108 (77.7) | 2.04 (1.20, 3.44) | 0.98 (0.47, 2.05) | 0.955 |
| Monthly pocket money (ETB) | 127 (31.5) | 276 (68.5) | 0.643 | ||
| ≤ 1,000 | 74 (34.7) | 139 (65.3) | 1 | 1 | |
| > 1,000 | 53 (27.9) | 137 (72.1) | 1.38 (0.90, 2.10) | 1.13 (0.67, 1.91) | |
| BMI (kg/m2) | Mean ± SD: 20.01 ± 2.97 | 0.95 (0.88, 1.01) | 0.94 (0.87, 1.02) | 0.126 | |
| Drinking status | 127 (31.5) | 276 (68.5) | 0.019** | ||
| Yes | 6 (13.6) | 38 (86.4) | 3.22 (1.32, 7.83) | 3.12 (1.20, 8.08) | |
| No | 121 (33.7) | 238 (66.3) | 1 | 1 | |
| Exercise | 127 (31.5) | 276 (68.5) | 0.338 | ||
| Yes | 75 (36.1) | 133 (63.9) | 0.65 (0.42, 0.99) | 0.81 (0.49, 1.32) | |
| No | 52 (26.7) | 143 (73.3) | 1 | 1 | |
| Underlying conditions | 127 (31.5) | 276 (68.5) | 0.286 | ||
| Yes | 26 (26.3) | 73 (73.7) | 1.40 (0.84, 2.32) | 1.37 (0.77, 2.46) | |
| No | 101 (33.2) | 203 (66.8) | 1 | 1 | |
| History of accidents | 127 (31.5) | 276 (68.5) | 0.020** | ||
| Yes | 118 (34.0) | 229 (66.0) | 2.69 (1.28, 5.68) | 2.68 (1.17, 6.13) | |
| No | 9 (16.1) | 47 (83.9) | 1 | 1 | |
* Percentages are rounded to 1 decimal place. Percentages are calculated using the row totals for each category. AOR and 95% CI were obtained from a multivariable logistic regression model. For categorical variables with more than two levels (e.g., Universities), the p-value represents the overall variable significance from the Wald chi-square test, while AORs are displayed for each category relative to the reference. For binary variables (e.g., sex, family residence), the p-value corresponds to the overall comparison between the two categories; the reference category (AOR = 1) has no separate p-value. **: p-value < 0.05 was considered significant. AOR: adjusted odds ratio; BMI: body mass index; CI: confidence interval; COR: crude odds ratio; DES: dry eye symptoms; ETB: Ethiopian Birrs; R&W: read and write.
Female participants were also more likely to report at least one DES symptom than males (AOR = 2.32; 95% CI: 1.25–4.31; p = 0.008) (Figure 3, Table 6). Likewise, students who reported current alcohol consumption had nearly three times higher odds of DES compared to non-drinkers (AOR = 3.12; 95% CI: 1.20–8.08; p = 0.019). Finally, participants with a history of accidents were also at increased risk (AOR = 2.68; 95% CI: 1.17–6.13; p = 0.020) (Table 6).
This study found that more than two-thirds (68.5%) of final-year technology students at public universities in southern Ethiopia who own and use digital devices reported having at least one symptom of DES/CVS (95% CI: 64.0%–73.0%). This prevalence is consistent with findings from other Ethiopian studies that used different but related assessment tools, including government employees in Debre Tabor Town (69.5%; 95% CI: 65.6%–73.0%) [6], university instructors (70.4%; 95% CI: 65.9%–74.5%) [7], secretaries at ministry offices in Addis Ababa (68.8%) [10], and employees of the Commercial Bank of Ethiopia in Addis Ababa (75.3%; 95% CI: 71.2%–79.2%) [11]. Additional studies among bank employees in Ethiopia reported CVS prevalence ranging between 68.0% and 79.1% [12, 13], and a systematic review and meta-analysis also synthesized a pooled prevalence of 73.2% (95% CI: 70.3%–76.1%) [18]. Similar findings have been documented in studies from other countries, despite differences in study populations and measurement tools [15–17].
The consistency of prevalence rates across diverse settings and populations may be explained by the rise in digital device use for academic, occupational, and recreational purposes, leading to comparable patterns of screen exposure and visual strain. Moreover, the use of similar research designs and validated tools across studies likely contributes to this uniformity. The convergence of these findings supports the robustness of the present result and indicates that DES/CVS represents an accurate and widespread public health concern rather than a methodological artifact. This further highlights the need for standardized diagnostic tools and the development of targeted prevention and intervention strategies at both national and global levels.
On the other hand, the prevalence observed in the current study was comparatively lower than that reported in previous studies conducted in other parts of Ethiopia, where study populations included academic staff [9] and postgraduate students [14] among university communities. This discrepancy may be partly attributed to differences in age distribution across the study populations. In the current study, over 90% of participants were aged between 20 and 24 years, whereas earlier studies involved older individuals. Additionally, occupational demands likely contributed to the variation in prevalence. Participants in the aforementioned studies were engaged in roles—such as data processing, secretarial duties, academic work, and postgraduate education—that typically entail prolonged exposure to digital screens, thereby increasing the risk of CVS/DES.
In the current study, the most commonly reported symptoms of DES were photophobia (136, 33.7%), irritation (burning sensation in the eyes) (119, 29.5%), headache (105, 26.1%), and eye strain (101, 25.1%). These findings align with those reported in similar studies [6, 7, 10, 11, 13, 14, 16] in which blurred vision, headache, and eye strain were reported to be the predominant symptoms of DES. The possible explanation for the similarity among these findings could be the common risk factors associated with DES. DES is triggered by similar risk factors across various populations, including prolonged use of digital devices, inadequate lighting, and improper viewing [23]. Additionally, DES produces uniform physiological responses and symptoms in different populations, such as eye strain and headaches [1, 24].
The university of enrollment was significantly associated with the presence of DES among participants. Students at Hawassa University were more likely to report DES compared with those at Jinka University (AOR = 2.43; 95% CI: 1.11–5.30; p = 0.026), whereas no significant difference was observed between students at Dilla University and Jinka University (AOR = 1.18; 95% CI: 0.55–2.52; p = 0.680). This disparity may be partly explained by differences in patterns of duration of device ownership across universities. For instance, in this study, it was revealed that students at Hawassa University were 3.28 times more likely to have owned digital devices for over two years compared with students at Jinka University (95% CI: 1.73–6.23; p < 0.001), while no significant difference was observed between Jinka and Dilla University students (p = 0.097). Although this association was bivariate and not adjusted for potential confounders, it provides a plausible explanation for the higher likelihood of reporting DES among Hawassa University students. Prolonged ownership of digital devices may increase screen exposure, particularly for academic and social purposes, leading to extended near work, reduced blink rates, and consequently, greater risk of DES [23].
In addition, environmental conditions, including dust exposure or indoor air quality, may also contribute to DES, although further research is needed to elucidate these relationships. Evidence from Hawassa indicates substantially elevated particulate matter (PM2.5 and PM10) concentrations in traffic corridors and school environments, often exceeding WHO air quality guidelines [25]. No formal studies have assessed air quality in Jinka, but real-time online sources [26] suggest it is comparatively better. Jinka is located in a less urbanized, forested region of South Omo, where dense vegetation traps airborne particles and reduces dust circulation. The town experiences minimal traffic, construction, and industrial activity, unlike Hawassa, a growing regional capital with higher population density and multiple combustion sources from vehicles, cooking, and waste burning. Hawassa’s proximity to the Rift Valley corridor and major roads further increases exposure to dust, particularly during dry seasons. Because dust exposure is known to irritate the ocular surface and destabilize the tear film [27, 28], these differences in particulate matter may partly explain the higher prevalence of DES among Hawassa students compared to those in Jinka.
Gender was one of the factors associated with DES in our study. Females had higher odds of acquiring DES than males (AOR = 2.32; 95% CI: 1.25–4.31; p = 0.008). This finding aligns with other studies in Ethiopia and elsewhere, which also reported a higher likelihood of females acquiring DES [7, 17]. A study on the prevalence and factors associated with CVS among university instructors in Ethiopia found that female instructors were 2.69 times more likely to develop CVS than their male counterparts (AOR 95% CI: 1.28–5.64) [7]. Another study from Sri Lanka [17] that assessed the 1-year prevalence of CVS among computer office workers indicated that females were more likely to experience CVS than males [odds ratio (OR) = 1.28; 95% CI: 1.05–1.57]. These findings suggest that females are more prone to acquiring DES and CVS, potentially due to hormonal differences and varying digital device usage patterns. Estrogen fluctuations during menstrual cycles, pregnancy, and menopause can affect tear production, the ocular surface, and inflammation, contributing to higher DES prevalence among females [29, 30]. In addition, some studies [31, 32] suggest that females may engage in longer durations of continuous screen use without breaks, increasing the risk of DES. This might be the case in these studies.
In this study, drinking status was found to be associated with the likelihood of developing DES. Participants who reported consuming alcohol at least once a week were more likely to experience at least one symptom of DES (AOR = 3.12, 95% CI: 1.20–8.08; p = 0.019). Existing studies on DES (CVS) have not examined the relationship between alcohol consumption and CVS. Thus, the current finding cannot be directly compared with similar studies. However, studies have assessed the relationship between alcohol and visual health and ocular conditions, including visual disturbances and discomfort, which may exacerbate symptoms of CVS, establishing the association between these variables [33]. Consequently, the current finding regarding the relationship between alcohol consumption and DES aligns with the established evidence.
In the current study, a history of accidents was associated with an increased likelihood of developing DES, and participants with a history of accidents were 2.68 times more likely to experience DES (95% CI: 1.17–6.13; p = 0.020). The reason for the association between a history of accidents and an increased likelihood of developing DES could be related to the impact of trauma on the ocular surface and tear film stability. Accidents, especially those involving head or eye injuries, can lead to ocular conditions, such as corneal abrasions, inflammation, and nerve damage, which may contribute to developing DES. Additionally, post-traumatic stress disorder (PTSD) and depression, which are common psychological consequences of accidents, have been associated with DES. It has been shown that individuals with PTSD or depression are more likely to experience severe dry eye symptoms [34]. Furthermore, the physical and emotional stress resulting from accidents may lead to changes in lifestyle and behavior, such as increased screen time and reduced blink rate, which can exacerbate DES symptoms [35].
In this study, age, family residence, parents’ occupations and education, the monthly pocket money they receive, BMI, and underlying conditions did not show statistically significant differences among the participants. The reason could be the demographic homogeneity of the participants.
The strength of this study is its multicenter design, which enables the identification of location-specific risk factors, thereby improving the comparative insights across various university settings.
However, the study has some limitations. The cross-sectional nature of the study limits the ability to establish temporal relationships or assess changes in digital device use and associated risk factors over time. Although information on dust exposure and indoor air quality was included to help explain inter-university differences, other spatiotemporal factors—such as wind speed, humidity, seasonal variation, and changes in digital device use over time—could not be analyzed due to a lack of available data. The findings are specific to technology students at universities in southern Ethiopia, which may limit their generalizability to other populations. Additionally, potential confounders like screen ergonomics and long-term behavioral patterns were not fully captured, and cognitive functions, such as attention, memory, or processing speed, were not assessed. These factors may affect the observed associations and should be explored in future studies.
In conclusion, this study found that more than two-thirds of undergraduate technology students at public universities in southern Ethiopia experienced at least one symptom of DES in the previous year. The most commonly reported symptoms included photophobia, a burning sensation in the eyes, headaches, and eye strain. Factors including the specific university the participants enrolled in, sex, alcohol consumption, and a history of accidents were associated with the likelihood of experiencing this condition.
These findings underline the significance of addressing DES among undergraduate students who own and utilize digital devices to ensure their well-being and academic performance. Universities and policymakers should consider implementing preventive measures and raising awareness about DES. Further research is needed to explore additional risk factors and effective interventions to alleviate this condition.
AOR: adjusted odds ratio
BMI: body mass index
CI: confidence interval
CVS: computer vision syndrome
DES: digital eye strain
DESQ: Digital Eye Strain Questionnaire
ETB: Ethiopian Birr
GPA: grade point average
ICC: intraclass correlation coefficient
ICT: information and communication technology
PTSD: post-traumatic stress disorder
The authors would like to acknowledge the study participants for generously giving their time to provide the data. We extend our gratitude to Hawassa University for the financial support and resources that made this research possible.
AI-assisted work statement: During the preparation of this work, the authors used Grammarly to assist in refining the clarity and readability of the manuscript text. After using the tool, authors reviewed and edited the content as needed and we take full responsibility for the content of the publication.
MHL and BE: Conceptualization, Investigation, Writing—original draft, Writing—review & editing, Formal analysis. S Alemayehu, DH, TB, TY, HG, MAA, AY, and S Assefa: Conceptualization, Investigation, Writing—original draft, Writing—review & editing. TK: Conceptualization, Investigation, Writing—original draft, Writing—review & editing, Funding acquisition, Project administration, Resources, Supervision, Validation. All authors read and approved the submitted version.
The authors declare that the research was conducted in the absence of any commercial or financial relationships that could be construed as a potential conflict of interest. The authors declare that they have no conflicts of interest.
This study was approved by the Research Ethics Review Committee (RERC) of Hawassa University (Ref. No.: RERC/11/2024, dated March 27, 2024), and official letters were received from the selected universities in which the data were collected. All procedures in this study were conducted in accordance with the Declaration of Helsinki.
Informed consent to participate in the study was obtained from all participants prior to data collection.
Not applicable.
The datasets generated and analyzed during the current study are available from the corresponding author upon request with no conditions or restrictions for access.
This study was funded by Hawassa University through its annual thematic research grant. The funders had no role in study design, data collection and analysis, decision to publish, or preparation of the manuscript.
© The Author(s) 2025.
Open Exploration maintains a neutral stance on jurisdictional claims in published institutional affiliations and maps. All opinions expressed in this article are the personal views of the author(s) and do not represent the stance of the editorial team or the publisher.
Copyright: © The Author(s) 2025. This is an Open Access article licensed under a Creative Commons Attribution 4.0 International License (https://creativecommons.org/licenses/by/4.0/), which permits unrestricted use, sharing, adaptation, distribution and reproduction in any medium or format, for any purpose, even commercially, as long as you give appropriate credit to the original author(s) and the source, provide a link to the Creative Commons license, and indicate if changes were made.