 Original Article

Affiliation:
1Department of Biochemistry, Jawaharlal Institute of Postgraduate Medical Education and Research, Puducherry 605006, India
Email: balasubramaniyan.v@jipmer.edu.in
ORCID: https://orcid.org/0000-0003-1708-4864
Affiliation:
1Department of Biochemistry, Jawaharlal Institute of Postgraduate Medical Education and Research, Puducherry 605006, India
ORCID: https://orcid.org/0000-0003-0422-598X
Affiliation:
2Department of Surgical Gastroenterology, Jawaharlal Institute of Postgraduate Medical Education and Research, Puducherry 605006, India
ORCID: https://orcid.org/0000-0002-8474-0270
Explor Dig Dis. 2025;4:100594 DOI: https://doi.org/10.37349/edd.2025.100594
Received: April 29, 2025 Accepted: September 01, 2025 Published: September 25, 2025
Academic Editor: Jian-Guo Chen, Qidong Liver Cancer Institute, China
The article belongs to the special issue Prevention, Screening and Diagnosis for Primary Liver Cancer
Aim: Hepatocellular carcinoma (HCC) poses a significant global health threat. The pregnane X receptor (PXR) is a central regulator of xenobiotic metabolism and plays a key role in mediating cellular resistance to anti-tumor drugs in HCC. Indeed, the precise role of PXR in HCC pathogenesis remains unclear. This study aimed to investigate blood and hepatic PXR levels and their association with inflammation in HCC patients. Additionally, we assessed the diagnostic potential of PXR in HCC patients compared to control subjects.
Methods: Following approval by the Institute Ethical Committee, 40 HCC patients and 40 healthy volunteers were enrolled in this study. Baseline patient characteristics, serum alpha-fetoprotein (AFP), and biochemical parameters were analyzed. Serum levels of PXR, tumor necrosis factor alpha (TNF-α), and interleukin (IL)-1β were measured using ELISA. The hepatic expression of phosphorylated nuclear factor kappa B (NFκB) and PXR proteins was analyzed by western blotting.
Results: When compared to control subjects, serum PXR levels were increased in HCC cases (1.34 ± 0.16 vs. 4.09 ± 0.33; P < 0.0001). Similarly, hepatic PXR expression was increased in HCC tissues. Moreover, HCC patients exhibited elevated inflammatory cytokines and a deranged hepatobiliary profile compared to controls.
Conclusions: Elevated serum PXR levels in HCC patients were positively correlated with inflammation. Notably, serum PXR demonstrated greater sensitivity and specificity in diagnosing HCC. These findings suggest that PXR may serve as a plausible biomarker in the diagnosis of HCC.
Liver cancer remains a major contributor to the global cancer burden and ranks third in estimated cancer-related deaths, driven by the rising prevalence of metabolic disorders, increasing alcohol consumption, and the shifting epidemiology resulting from advances in hepatitis B virus (HBV) vaccination and effective antiviral therapies for hepatitis C virus (HCV) [1]. Hepatocellular carcinoma (HCC), which accounts for approximately 75% of primary liver cancer cases and deaths worldwide [2], has a complex pathogenesis involving various genetic and epigenetic alterations. HCC incidence varies geographically worldwide, with approximately 900,000 new cases reported, with around 760,000 deaths attributed to the disease. Notably, the expected incidence of HCC is projected to increase by 55% from 2020 to 2040 [3]. The etiology of HCC is primarily linked to chronic inflammation caused by hepatitis B and C viral infections, as well as cirrhosis [4]. Although several candidate drugs have failed in clinical trials as frontline treatments for HCC, a number of kinase inhibitors and immunotherapeutics have been approved by the U.S. Food and Drug Administration (FDA). The first systemic drug approved as a standard frontline therapy for HCC was sorafenib, a kinase inhibitor targeting multiple signaling pathways [5]. However, Feng et al. [6] demonstrated that while sorafenib is initially effective in some HCC patients, the majority eventually develop resistance. This resistance is partly attributed to sorafenib’s activation of the pregnane X receptor (PXR), a nuclear hormone receptor [6]. PXR functions as a cellular xenobiotic sensor, playing a protective role by promoting the clearance of potentially harmful foreign substances. Notably, its expression is predominantly observed in hepatic and intestinal tissues [7, 8].
Beyond its well-established role in chemoresistance, the PXR has emerged as a key regulator of various metabolic pathways [7]. In addition, PXR influences several cancer-related processes, including cell cycle arrest, inflammation, and angiogenesis, which are hallmarks of carcinogenesis [7, 9]. Interestingly, PXR expression varies significantly across different cancer types [10]. Overexpression of PXR in breast, esophageal, and bone cancers has been linked to the upregulation of multidrug resistance (MDR) genes, which can facilitate cancer progression [11]. Conversely, in colon, prostate, and cervical cancers, PXR expression is markedly reduced. Restoration of its activity in these contexts has been shown to suppress cell proliferation, suggesting a tumor-suppressive function [10]. However, the role of PXR in HCC remains poorly defined. In HuH7 cells, PXR activation has been reported to suppress cell proliferation and migration [12]. In contrast, studies in HepG2 cells have shown that PXR activation promotes changes in cell morphology and enhances migration via activation of the p38 MAPK signaling pathway [13]. Additionally, the inflammatory microenvironment associated with HCC leads to the activation of Kupffer cells, which release proinflammatory cytokines such as tumor necrosis factor alpha (TNF-α) and interleukin (IL)-1β via the nuclear factor kappa B (NFκB) pathway. In this study, we aimed to assess the PXR levels in both systemic circulation and liver tissue, examine their relationship with key inflammatory markers in HCC, and evaluate their potential as a diagnostic biomarker by comparing HCC patients with apparently healthy individuals.
This case-control study was conducted from September 2018 to February 2020 in the Department of Biochemistry, in collaboration with the Department of Surgical Gastroenterology at the Jawaharlal Institute of Postgraduate Medical Education and Research (JIPMER), Puducherry, India. Ethical approval was obtained from the Institute Ethics Committee (JIP/IEC/2018/0282), and the study adhered to the Indian Council of Medical Research (ICMR) biomedical guidelines and the Declaration of Helsinki. Written informed consent was obtained from all participants prior to enrollment.
Consecutive patients were recruited. Both male and female participants aged 20–60 years were enrolled and divided into two groups: healthy controls (n = 40) and HCC patients (n = 40). Controls were selected based on normal liver function tests and the absence of any recent infections or tumors. HCC patients meeting the inclusion criteria in line with the European Association for the Study of the Liver (EASL) criteria. Moreover, critically ill patients and those with rare variants like fibrolamellar carcinoma were excluded, as this subtype can complicate HCC diagnosis. Non-invasive imaging techniques were used to distinguish fibrolamellar carcinoma from classical HCC. HCC diagnosis was based on ultrasonography and confirmed through CT or MRI, supported by elevated alpha-fetoprotein (AFP) levels or histopathological analysis. Tumor characteristics, including lesion count, vascular invasion, and metastasis, were assessed via CT or MRI and reviewed by an independent radiologist at JIPMER. Confirmation of HCC was done by biopsy or ultrasound-guided fine needle aspiration cytology (FNAC), interpreted by a blinded pathologist. Disease severity was evaluated using the Child-Pugh score, and staging was conducted according to the Barcelona Clinic Liver Cancer (BCLC) system.
All patients’ demographic and clinical data were collected at admission. Furthermore, approximately 5 mL of blood was collected from both control subjects and HCC patients into clot activator tubes (BD Vacutainer, REF 369032) and allowed to stand for one hour. The samples were then centrifuged at 1,000 × g for 10 min at 4°C to separate the serum. Routine biochemical analyses were performed immediately using the fresh serum, while the remaining samples were aliquoted and cryopreserved at –80°C for further analysis.
Liver tumor tissues and adjacent non-tumorous tissues (histologically confirmed as controls) were obtained from HCC patients undergoing hepatectomy as part of their treatment protocol. Each resected tissue sample was divided: one portion was fixed in 10% neutral buffered formalin (NBF) for histological examination, and the other was snap-frozen in liquid nitrogen and stored at –80°C for molecular studies.
Liver function markers, including bilirubin, total protein, albumin, alanine aminotransferase (ALT), aspartate aminotransferase (AST), alkaline phosphatase (ALP), and gamma-glutamyltransferase (γGT), were measured using commercially available kits (Beckman Coulter Ireland, Inc.) on a Beckman Coulter AU5800 autoanalyzer (USA), following the manufacturer’s instructions. Prothrombin time (PT) and international normalized ratio (INR) were assessed using a chemiluminescence immunoassay system (Siemens ADVIA Centaur CP). Serum AFP levels were quantified by chemiluminescence using the UniCel DxI 600 Access Immunoassay System (Beckman Coulter, USA; 33210).
Serum PXR and IL-1β concentrations were estimated using sandwich ELISA kits from FineTest, Wuhan Fine Biotech Co., Ltd, Wuhan, China (PXR: Cat. No. EH1200; IL-1β: Cat. No. EH0185), and serum TNF-α was assessed using the human TNF-α ELISA kit (Cat. No. KB1145; Krishgen Biosystems, USA) as per the manufacturer’s instructions. Briefly, standards and serum samples were added to microplate wells pre-coated with target-specific antibodies. After incubation and washing to remove unbound substances, a biotinylated detection antibody and streptavidin-HRP conjugate were added sequentially. The resulting colorimetric reaction, following substrate addition, was measured at the appropriate wavelength using a microplate reader (Spectra max Plus 384; Serial No: AMNR06890; Thermo Fisher Scientific Inc.). Concentrations of PXR, TNF-α, and IL-1β were calculated by comparing absorbance values to a standard curve generated for each target analyte.
ROC curve analysis was conducted using GraphPad Prism version 10 (San Diego, CA, USA) and MedCalc (version 23.3.7; MedCalc Software Ltd) to evaluate the diagnostic performance of AFP and PXR in HCC patients. The cut-offs for PXR, AFP were chosen based on ROC analysis and Youden’s index, providing strong sensitivity and specificity for distinguishing HCC from non-HCC individuals.
Total protein was extracted from tumorous and non-tumorous liver tissues of HCC patients using ice-cold RIPA buffer (Cat. # 786-489; G-Biosciences, USA) containing a protease inhibitor cocktail and PMSF (Cat. # P8340 and 11359061001, respectively; Sigma-Aldrich, USA). Protein concentrations were determined using the Pierce Coomassie Plus (Bradford) protein assay kit (Cat. # 23236; Thermo Fisher Scientific, USA). Protein samples (~30 μg) were separated by SDS-PAGE on 7.5% and 10% polyacrylamide gels and transferred to nitrocellulose membranes (S045A330R; Advantec, Japan). Membranes were blocked and incubated with rabbit polyclonal anti-PXR (Cat. # A1583; ABclonal, USA) and rabbit monoclonal phosphorylated anti-NFκB-p65 (Cat. # 3033 1:1,000; Cell Signaling, UK), and mouse monoclonal anti-β-actin (Cat. # AC004; ABclonal, USA) antibodies at recommended dilutions. After overnight incubation, membranes were probed with HRP-conjugated goat anti-rabbit or goat anti-mouse secondary antibodies (Cat. # 405306; BioLegend, USA). Protein bands were visualized using an enhanced chemiluminescent substrate (Cat. # 32209; Thermo Fisher Scientific, USA) and imaged on a ChemiDoc XRS+ system (Cat. # 1708265; Bio-Rad, USA). Densitometry analysis was performed using Image Lab software (V 6.1.0; Bio-Rad, USA), and target bands were normalized to β-actin.
Paraffin blocks of 10% NBF-fixed tumorous and non-tumorous liver tissues were prepared. Serial 5 μm sections were obtained using an automated microtome (Cat. # 149AUTO00C1; Leica Biosystems) and stained with hematoxylin and eosin (H&E). Histological characteristics of the HCC tumor and non-tumorous tissues (control liver) were assessed by an independent, blinded pathologist from the Department of Pathology, JIPMER. For immunohistochemistry (IHC), tissue sections were placed on silane-coated slides, deparaffinized in xylene, and rehydrated. Endogenous peroxidase activity was blocked with 3% H2O2 (Cat. # 88597; Sigma-Aldrich, USA) and rinsed with phosphate-buffered saline (PBS). Antigen retrieval was performed by incubating sections in citrate buffer (pH 6.0) (Cat. # ALF-J63950-AP; Thermo Fisher Scientific, USA) at 110°C for 10 min. The sections were then blocked with 2.5% normal horse serum for 20 min and incubated overnight with rabbit polyclonal anti-PXR (1:100, Cat. # A1583; ABclonal, USA) at 4°C. After washing with PBS, sections were incubated with ImmPRESS Universal Polymer Reagent (MP-7500; Vector Labs, USA) for 30 min at room temperature. PXR localization was detected using the ImmPACT DAB kit (SK4105; Vector Labs, USA), and sections were counterstained with hematoxylin. Negative controls were included using a no-primary antibody condition. Finally, sections were dehydrated, mounted with Histomount (Cat. # 008030; Thermo Fisher Scientific, USA), and photographed using an EVOS FLc imaging system (Cat. # AME3300; Life Technologies, USA).
Data were analyzed using GraphPad Prism version 10 (San Diego, CA, USA) and MedCalc (version 23.3.7; MedCalc Software Ltd). Qualitative data are presented as counts and percentages, while quantitative data are expressed as mean ± standard error (SE). A two-tailed unpaired t-test or Mann-Whitney U test was used to compare cases and controls. Spearman’s correlation analysis assessed associations between parameters. ROC curve analysis for AFP and PXR was performed to evaluate diagnostic accuracy in HCC participants. P values < 0.05 were considered statistically significant.
Table 1 shows the clinical and tumor radiological characteristics of HCC patients. The Child-Pugh score was used to assess the disease severity and was distributed as Child class A (60%), Child class B (32.5%), and Child class C (7.5%). BCLC staging was also done for HCC participants and accordingly found to be in stages A (12.5%), B (27.5%), C (55%), and D (5%). Among the HCC participants, 65% had one lesion, 20% had two lesions, 7.5% had three, and 7.5% had multifocal lesions. Hepatic and portal vein invasions were observed in 27.5% and 37.5% of HCC participants, respectively. 22.5% were hepatitis B surface antigen (HBsAg) positive and 17.5% were HCV positive. Cirrhosis was present in 62.5% of HCC participants.
Clinical and tumor radiological characteristics of the study population.
| Characters | N (total 40) | % (total 100) |
|---|---|---|
| Child class | ||
| A | 24 | 60.0 |
| B | 13 | 32.5 |
| C | 3 | 7.5 |
| BCLC staging | ||
| Stage A | 5 | 12.5 |
| Stage B | 11 | 27.5 |
| Stage C | 22 | 55.0 |
| Stage D | 2 | 5.0 |
| No. of lesions | ||
| Single lesion | 26 | 65.0 |
| Two lesions | 8 | 20.0 |
| Three lesions | 3 | 7.5 |
| Multifocal lesions | 3 | 7.5 |
| Hepatic vein invasion | ||
| Present | 11 | 27.5 |
| Absent | 29 | 72.5 |
| Metastasis | ||
| Present | 2 | 5.0 |
| Absent | 38 | 95.0 |
| Portal vein invasion | ||
| Present | 15 | 37.5 |
| Absent | 25 | 62.5 |
| Hepatitis infection | ||
| No hepatitis infection | 24 | 60.0 |
| HBsAg positive | 9 | 22.5 |
| HCV positive | 7 | 17.5 |
| Cirrhosis | ||
| Present | 25 | 62.5 |
| Absent | 15 | 37.5 |
BCLC: Barcelona Clinic Liver Cancer; HBsAg: hepatitis B surface antigen; HCV: hepatitis C virus.
Serum levels of liver function parameters are given in Table 2. Levels of total and direct bilirubin, AST, ALT, γGT, ALP, PT, and INR increased significantly, while serum albumin level was decreased in HCC cases compared to controls. Furthermore, higher AFP levels (P < 0.0001) were observed in HCC cases compared to healthy controls.
Comparison of biochemical parameters in healthy controls and HCC participants.
| Parameters | Healthy controls (n = 40) mean ± SE | HCC cases (n = 40) mean ± SE | P-value |
|---|---|---|---|
| Gender (M/F) | 29/11 | 32/8 | - |
| Age (years) | 48.9 ± 8.52 | 53.8 ± 6.34 | - |
| BMI (kg/m2) | 23.46 ± 4.22 | 27.62 ± 5.68 | P < 0.001 |
| Total bilirubin (mg/dL) | 0.47 ± 0.048 | 5.57 ± 1.11 | P < 0.001 |
| Direct bilirubin (mg/dL) | 0.18 ± 0.015 | 2.69 ± 0.57 | P < 0.001 |
| Total protein (g/dL) | 6.638 ± 0.156 | 6.81 ± 0.16 | NS |
| Albumin (g/dL) | 3.625 ± 0.113 | 3.048 ± 0.11 | P < 0.001 |
| AST (IU/L) | 27.05 ± 1.639 | 188.6 ± 26.67 | P < 0.001 |
| ALT (IU/L) | 31.03 ± 3.414 | 85.66 ± 18.87 | P < 0.0001 |
| ALP (IU/L) | 80.95 ± 6.636 | 525.2 ± 134.4 | P < 0.001 |
| γGT (IU/L) | 36.63 ± 5.774 | 409.2 ± 114.7 | P < 0.001 |
| PT (s) | 11.69 ± 0.81 | 15.87 ± 1.05 | P < 0.001 |
| INR | 1.02 ± 0.024 | 1.305 ± 0.09 | P < 0.001 |
| AFP (ng/mL) | 12.60 ± 0.839 | 508.6 ± 117.2 | P < 0.0001 |
-: No statistical comparison was performed between groups. HCC: hepatocellular carcinoma; SE: standard error; BMI: body mass index; NS: non-significant; AST: aspartate aminotransferase; ALT: alanine aminotransferase; ALP: alkaline phosphatase; γGT: gamma-glutamyltransferase; PT: prothrombin time; INR: international normalized ratio; AFP: alpha-fetoprotein.
PXR, TNF-α, and IL-1β serum concentrations were increased (P < 0.0001) in HCC cases compared to control subjects (Figure 1A–C). Furthermore, serum levels of PXR showed a positive correlation with TNF-α and IL-1β (r = 0.456, P < 0.001; r = 0.476, P < 0.0001 respectively; Figure 1D and E). Moreover, a positive correlation was noted between PXR and elevated γGT levels (r = 0.490, P < 0.0001; Figure 1F and G). Notably, subgroup analysis among HCC cases revealed that PXR concentration was higher (P < 0.05) in alcoholic HCC as compared to non-alcohol-related HCC (Figure 1H). We also observed PXR expression according to BCLC staging in HCC patients (Figure 1I). PXR expression was significantly higher in stage B and stage C compared to stage A (P = 0.009 and P = 0.001, respectively). Although PXR levels were elevated in stage C compared to stage B, this difference was not statistically significant.
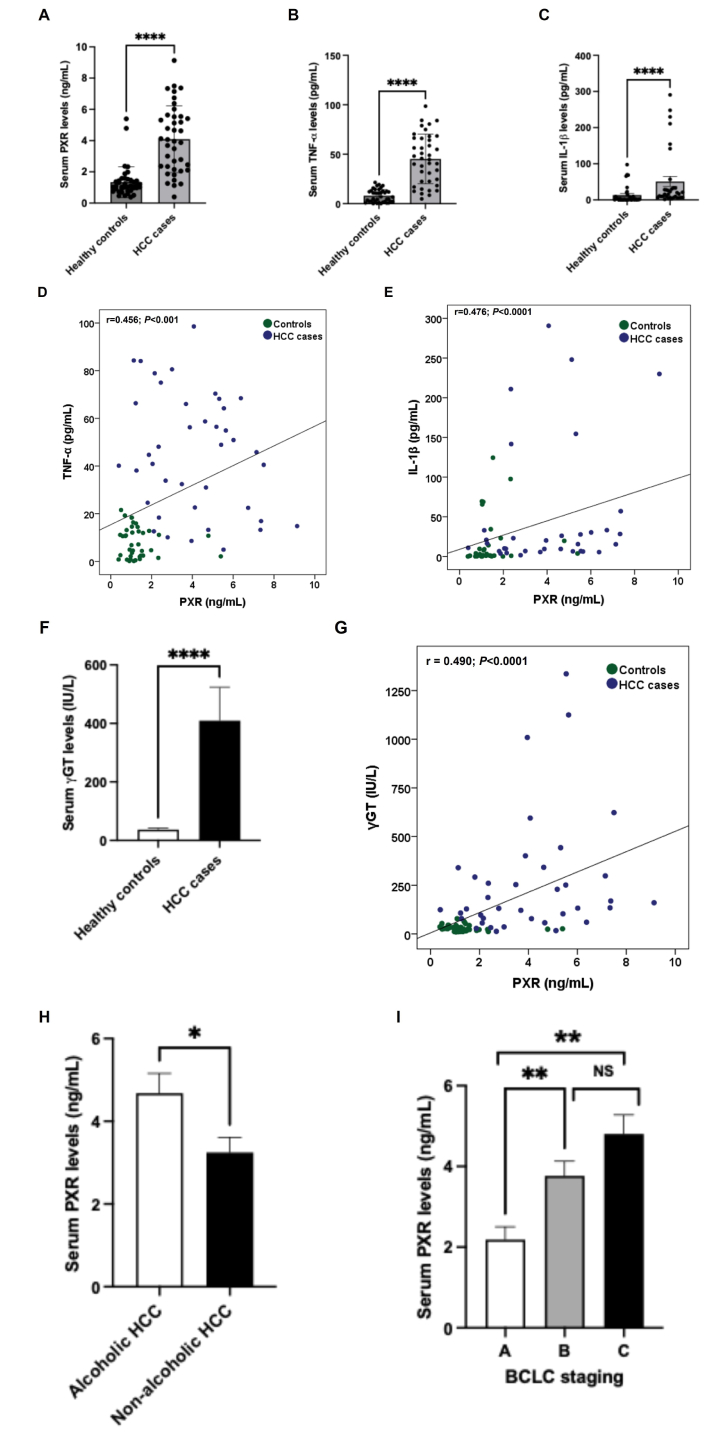
Serum PXR and proinflammatory cytokine concentrations in control subjects and HCC cases. Serum PXR (A), TNF-α (B), and IL-1β (C) levels in controls and cases. (D) Correlation between PXR and TNF-α in controls and cases. (E) Correlation between PXR and IL-1β in controls and cases. (F) Serum γGT levels in controls and cases. (G) Correlation between PXR and γGT in controls and cases. (H) Serum PXR levels between non-alcohol-related and alcohol-related subgroups of cases. (I) Serum PXR levels in different BCLC staging of HCC patients. All the data are expressed as mean ± SE. The comparison between groups was performed using either a two-tailed unpaired t-test or the Mann-Whitney U test, as appropriate. Spearman’s correlation was performed to study the association between PXR with TNF-α, IL-1β, and γGT levels. ****: P < 0.0001 compared to controls; *: P < 0.05; **: P < 0.01 compared to BCLC stage A; r: correlation coefficient. PXR: pregnane X receptor; HCC: hepatocellular carcinoma; TNF-α: tumor necrosis factor alpha; IL: interleukin; γGT: gamma-glutamyltransferase; BCLC: Barcelona Clinic Liver Cancer; SE: standard error; NS: non-significant.
Figure 2 illustrates the ROC curve analysis of AFP and PXR for evaluating their diagnostic performance in HCC participants. AFP at a cut-off value > 18.9 ng/mL achieved an AUC of 0.883, with 83% sensitivity and 88% specificity, yielding a positive likelihood ratio (LR+) of 6.6 and a negative likelihood ratio (LR–) of 0.2 (Figure 2A). PXR at a cut-off value > 2.014 ng/mL demonstrated an AUC of 0.902, with 83% sensitivity and 90% specificity, corresponding to an LR+ of 8.3 and an LR– of 0.19 (Figure 2B). Figure 2C shows a pairwise comparison of ROC curves between PXR and AFP (ng/mL) using DeLong’s test [14]. The comparison between PXR and AFP ROC curves shows a small difference in AUCs (0.0191), with a non-significant P-value of 0.7616. The 95% confidence interval for the difference includes zero (–0.104 to 0.142), and the z statistic is 0.303, indicating no statistically significant difference in diagnostic performance between PXR and AFP.
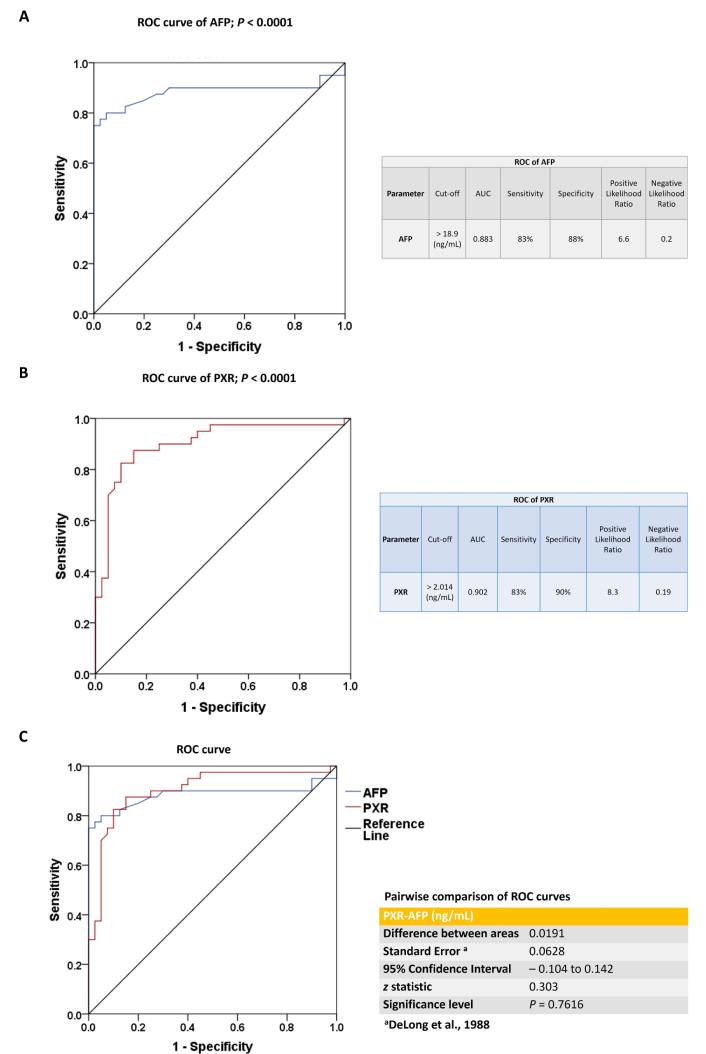
The ROC curve analysis of AFP and PXR. (A) ROC analysis of AFP in the study population. (B) ROC analysis of PXR in the study population. (C) Pairwise comparison of ROC curves between PXR and AFP (ng/mL) using DeLong’s test. All the data are expressed as mean ± SE. The comparison between groups was performed using either a two-tailed unpaired t-test or the Mann-Whitney U test, as appropriate. ROC: receiver operating characteristic; AFP: alpha-fetoprotein; AUC: area under the curve; PXR: pregnane X receptor; SE: standard error.
Figure 3A shows the H&E-stained liver section of non-tumorous (control liver) and tumorous tissue obtained from HCC participants. The control liver showed typical hepatic lobular architecture characterized by densely stained hepatocyte cytoplasm with prominent granularity, round nuclei, and nucleoli arranged in regular cords or plates separated by sinusoids. The portal zone included connective tissue, hepatic artery, portal vein, and bile duct. The HCC liver tissue showed classical features of HCC characterized by the presence of malignant cells, thick trabecular cords, well-differentiated and interdigitated with scant basophilic cytoplasm, nuclear overcrowding, and hyperchromatic nuclei.
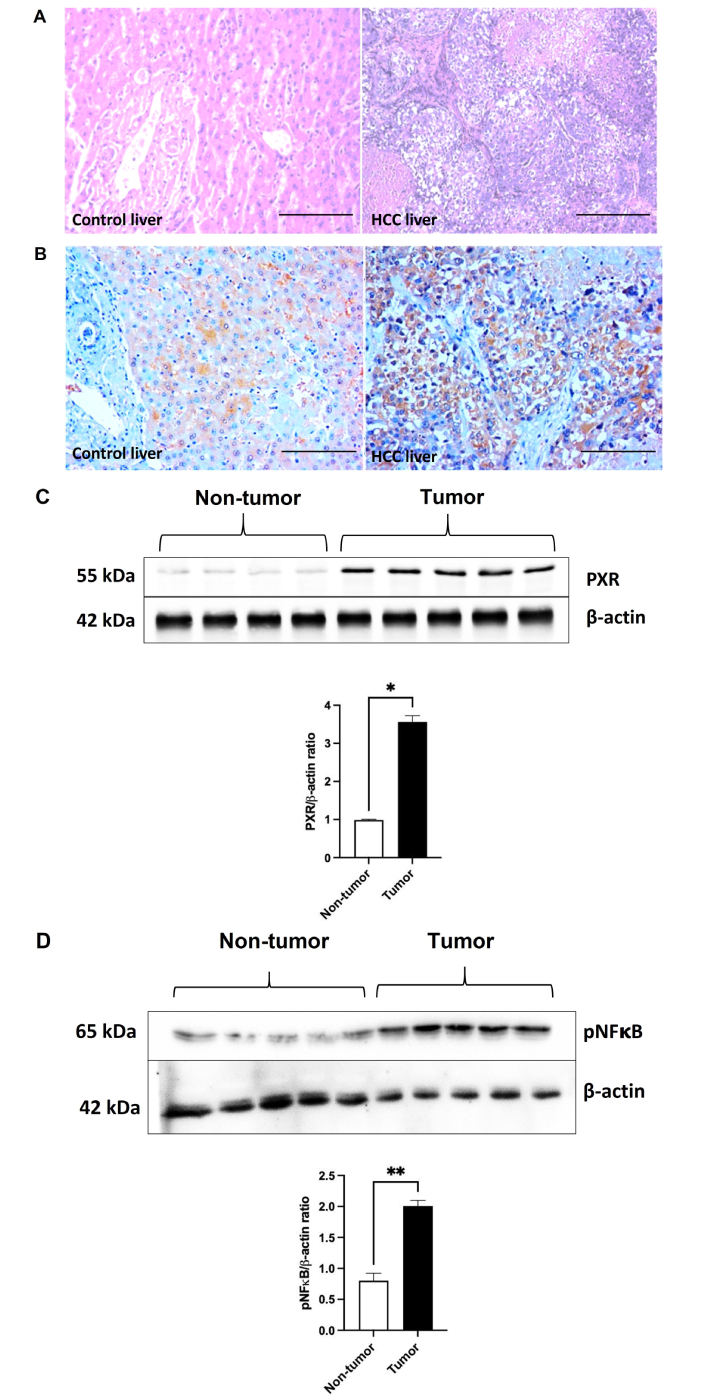
PXR expression in tumor and non-tumorous liver tissues. (A) Representative images of H&E-stained liver sections of non-tumorous (control liver) and tumor tissue (HCC liver) from HCC participants (200× magnification; scale bar: 75 μm). (B) Representative images of PXR immunostaining of liver sections of non-tumorous (control liver) and tumor tissue (HCC liver) from HCC participants (200× magnification; scale bar: 75 μm). (C) Hepatic PXR protein expression [non-tumorous tissue (n = 4); tumor tissue (n = 5)] and (D) hepatic phosphorylated NFκB 65 expression [non-tumorous tissue (n = 5); tumor tissue (n = 5)] by western blot in non-tumorous and tumor tissue from HCC participants. All the data are expressed as mean ± SE. The comparison between groups was performed using either a two-tailed unpaired t-test or the Mann-Whitney U test, as appropriate. *: P < 0.05 & **: P < 0.01 compared to non-tumor. HCC: hepatocellular carcinoma; PXR: pregnane X receptor; pNFκB: phosphorylated nuclear factor kappa B; H&E: hematoxylin and eosin; SE: standard error.
Figure 3B shows immunostaining of PXR on sections of the control liver and HCC liver. Control liver tissue showed moderate cytoplasmic and focal nuclear PXR positivity, while HCC liver tissue demonstrated strong cytoplasmic and focal nuclear PXR positivity. Figure 3C shows hepatic PXR protein expression by western blot in the control liver and HCC tumor tissues. PXR protein expression was increased (P < 0.05) in HCC tumor tissue compared to control liver tissue. Similarly, hepatic phosphorylated NFκB expression was significantly increased in the HCC liver compared to the control liver (Figure 3D).
In this study, systemic PXR concentration was elevated in HCC patients compared to control subjects. We also found increased serum inflammatory cytokines, such as TNF-α and IL-1β levels, in HCC patients compared to control subjects. Additionally, elevated PXR observed in HCC patients was positively correlated with elevated proinflammatory cytokines. Interestingly, elevated systemic PXR concentration positively correlated with elevated γGT, and the levels were higher in alcoholic HCC than in non-alcoholic HCC. In addition, we observed significantly elevated hepatic PXR expression in tumor tissues compared to adjacent non-tumor liver tissue. Similarly, hepatic inflammation was increased in tumor tissues, as indicated by elevated levels of phosphorylated NFκB.
Several studies have implicated PXR in cancer development. In the liver, PXR is expressed not only in hepatocytes but also in Kupffer and hepatic stellate cells [15], with expression levels varying during liver development. In our study, we observed significantly higher hepatic PXR expression in liver tumors compared to non-cancerous tissue. This may reflect differences in PXR activation and hepatocyte proliferation, both of which can promote HCC progression. Although previous in vivo and in vitro studies reported reduced PXR expression in liver cancer models [9, 11], its pleiotropic roles in HCC remain poorly understood. Notably, Yoshinari [16] demonstrated that the constitutive androstane receptor (CAR), which interacts with PXR, suppresses cell-cycle inhibitor genes, thereby promoting hepatocyte proliferation and HCC progression. Shizu et al. [17] further showed that co-activation of PXR and CAR in mice synergistically induces hepatocyte proliferation and carcinogenesis. PXR overexpression has also been linked to reduced efficacy of anti-cancer drugs such as doxorubicin and sorafenib via TGF-β-mediated chemoresistance [18]. In line with this, Feng et al. [6] found that sorafenib treatment activates PXR and its downstream targets (e.g., CYP3A4 and MDR1), promoting drug resistance in HCC patients. Indeed, its potential role in different stages of HCC tumor development needs further investigation. We found significantly increased hepatic PXR expression in HCC cases, consistent with increased distribution of PXR in the cytosol and the nucleus, as evidenced by IHC. Serum PXR levels were also significantly higher compared to healthy controls. Although the sample size for the subgroup analysis was limited, we observed that PXR expression varied with disease stage. Patients in BCLC stages B and C showed significantly higher serum PXR levels compared to those in stage A, suggesting a correlation between PXR expression and disease severity. We speculate that frequent exposure to PXR-activating chemotherapeutics, such as sorafenib and doxorubicin, contributes to this increase. In contrast, diethyl nitrosamine (DEN) or carbon tetrachloride (CCl4)-induced mouse models of HCC do not fully capture the complexity of the human tumor microenvironment, treatment history, and disease progression. Thus, the role of PXR in different stages of HCC remains to be fully elucidated and warrants further investigation.
Inflammation plays a key contributory role in the development and progression of HCC, and most incidences of HCC have altered inflammatory marker levels [2]. NFκB is a transcription factor and an important molecule linking chronic inflammation to cancer [19]. Its activity is primarily induced by proinflammatory cytokines such as TNF-α and IL-β and bacterial endotoxins. Many clinical studies have shown evidence that NFκB activation occurs in cancer cells and in the tumor microenvironment of HCC [20]. Expression of NFκB within Kupffer cells is fundamental for the development of HCC [21]. Herein, we observed increased hepatic phosphorylated NFκB protein expression in HCC compared to control subjects. We also noted significantly elevated systemic TNF-α and IL-β levels in HCC, and these were positively correlated with elevated PXR levels. However, our study differs from previous findings that PXR mitigates inflammation through negative regulation of NFκB [22] and proinflammatory cytokines [11]. Alternatively, IL-1β, IL-6, and TNF-α have been reported to down-regulate PXR expression in mice [23]. Indeed, the role of inflammation in promoting PXR expression in liver cancer needs further investigation.
Our study provides compelling evidence that elevated PXR may serve as a novel diagnostic marker for HCC pathogenesis. Although AFP has been used for this purpose, its limited sensitivity and specificity have restricted its diagnostic effectiveness [24, 25]. In contrast, serum PXR demonstrated higher sensitivity, specificity, and likelihood ratio than AFP in diagnosing HCC. However, the pairwise comparison of ROC curves revealed no statistically significant difference between PXR and AFP in their ability to distinguish HCC from controls. Thus, DeLong’s analysis confirms that PXR performs comparably to AFP as a diagnostic marker in this study population. Additionally, elevated serum PXR levels in HCC patients showed a positive correlation with γGT levels, prompting a subgroup analysis despite the small sample size of alcohol-related HCC cases (n = 13). Notably, PXR levels were higher in alcohol-related HCC compared to non-alcohol-related cases. In this context, Choi et al. [26] reported that chronic ethanol exposure significantly upregulated the mRNA levels of PXR, CAR, and the CAR target gene CYP2B10 in wild-type mice, but not in PXR-null mice. This PXR-dependent response also increased the gene and protein expression of early growth response-1 (EGR-1). EGR-1, in turn, upregulates sterol regulatory element binding protein (SREBP)-1c target genes like fatty acid synthase (FAS) and TNF-α, contributing to ethanol-induced steatosis [26]. These findings suggest that PXR signaling plays a key role in alcohol-related liver disease (ALD) and that PXR antagonists may represent a potential therapeutic strategy for ALD. Indeed, increased PXR levels observed in alcohol-induced HCC remain to be investigated. The limitations of the current study are the lack of data on the relationship between PXR and the survival and prognosis of HCC. This study also lacks an external validation cohort, limiting the generalizability of the findings. Moreover, we used a relatively small sample size, which may influence the observed expression levels of PXR, the determined cut-off value for AFP in HCC diagnosis, and the overall diagnostic performance of both biomarkers. PXR levels measured by ELISA may not have been fully accurate; however, in our future studies, we plan to use liquid chromatography-mass spectrometry (LC-MS) for a more precise quantification of PXR in HCC.
In conclusion, to the best of our knowledge, this study is the first to demonstrate that serum PXR levels are significantly elevated in patients with HCC, accompanied by increased hepatic PXR expression. ROC curve analysis further revealed that PXR has strong diagnostic potential, underscoring its promise as a novel biomarker for HCC. Nonetheless, validation through larger, independent cohorts is essential to confirm these findings and establish clinical utility.
AFP: alpha-fetoprotein
ALD: alcohol-related liver disease
ALP: alkaline phosphatase
ALT: alanine aminotransferase
AST: aspartate aminotransferase
BCLC: Barcelona Clinic Liver Cancer
CAR: constitutive androstane receptor
EGR-1: early growth response-1
H&E: hematoxylin and eosin
HCC: hepatocellular carcinoma
HCV: hepatitis C virus
IHC: immunohistochemistry
IL: interleukin
INR: international normalized ratio
LR–: negative likelihood ratio
LR+: positive likelihood ratio
MDR: multidrug resistance
NBF: neutral buffered formalin
NFκB: nuclear factor kappa B
PBS: phosphate-buffered saline
PT: prothrombin time
PXR: pregnane X receptor
ROC: receiver operating characteristic
TNF-α: tumor necrosis factor alpha
γGT: gamma-glutamyltransferase
The authors are grateful to all the HCC patients/healthy volunteers who participated in this study. The authors thank Dr Amit Kumar Ram and Dr Devanatha Desikan for their contribution in performing western blotting and statistical analysis, respectively.
BV: Conceptualization, Supervision, Formal analysis, Validation, Visualization, Funding acquisition, Writing—original draft, Writing—review & editing. TM: Investigation, Formal analysis. BP: Visualization, Writing—review & editing. All authors read and approved the submitted version.
The authors declare that they have no conflicts of interest.
This study was reviewed and approved by the JIPMER Post-Graduate Monitoring Committee (PGRMC) and the Institute Ethics Committee (IEC) for human studies (JIP/IEC/2018/0282).
Written informed consent was obtained from all the participants to participate in the study.
Not applicable.
Data will be shared on reasonable request to the corresponding author.
This work was supported by the JIPMER intramural research grant [JIP/Res/Intramural/0282/2018-19]. The funders had no role in study design, data collection and analysis, decision to publish, or preparation of the manuscript.
© The Author(s) 2025.
Open Exploration maintains a neutral stance on jurisdictional claims in published institutional affiliations and maps. All opinions expressed in this article are the personal views of the author(s) and do not represent the stance of the editorial team or the publisher.
Copyright: © The Author(s) 2025. This is an Open Access article licensed under a Creative Commons Attribution 4.0 International License (https://creativecommons.org/licenses/by/4.0/), which permits unrestricted use, sharing, adaptation, distribution and reproduction in any medium or format, for any purpose, even commercially, as long as you give appropriate credit to the original author(s) and the source, provide a link to the Creative Commons license, and indicate if changes were made.

View: 2488
Download: 33
Times Cited: 0
Muhammad Sulaiman ... Chunyu Sun
