 Review

Affiliation:
1Liver Research Unit, Medica Sur Clinic and Foundation, Mexico City 14050, Mexico
ORCID: https://orcid.org/0009-0005-6539-0542
Affiliation:
1Liver Research Unit, Medica Sur Clinic and Foundation, Mexico City 14050, Mexico
ORCID: https://orcid.org/0009-0004-8770-586X
Affiliation:
1Liver Research Unit, Medica Sur Clinic and Foundation, Mexico City 14050, Mexico
2Plan of Combined Studies in Medicine (PECEM-MD/PhD), Faculty of Medicine, National Autonomous University of Mexico, Mexico City 04360, Mexico
ORCID: https://orcid.org/0009-0005-6279-1527
Affiliation:
1Liver Research Unit, Medica Sur Clinic and Foundation, Mexico City 14050, Mexico
2Plan of Combined Studies in Medicine (PECEM-MD/PhD), Faculty of Medicine, National Autonomous University of Mexico, Mexico City 04360, Mexico
ORCID: https://orcid.org/0009-0001-0210-4458
Affiliation:
1Liver Research Unit, Medica Sur Clinic and Foundation, Mexico City 14050, Mexico
3Faculty of Medicine, National Autonomous University of Mexico, Mexico City 04360, Mexico
Email: nmendez@medicasur.org.mx
ORCID: https://orcid.org/0000-0001-5257-8048
Explor Dig Dis. 2026;5:1005115 DOI: https://doi.org/10.37349/edd.2026.1005115
Received: January 26, 2026 Accepted: February 27, 2026 Published: March 13, 2026
Academic Editor: Ali Canbay, University Hospital Knappschaftskrankenhaus Bochum, Ruhr-University Bochum, Germany
Metabolic dysfunction-associated steatotic liver disease (MASLD) is a systemic metabolic disorder closely related to insulin resistance, obesity, and type 2 diabetes mellitus. While sustained hyperglycemia and insulin resistance are central to the pathogenesis of MASLD, there is growing evidence suggesting that glucose dysregulation in this condition is heterogeneous and dynamic. Glycemic variability (GV), which reflects fluctuations in glucose levels over time, has emerged as a complementary dimension of glucose homeostasis and has been increasingly explored in relation to hepatic steatosis, fibrosis, and cardiometabolic risk. Experimental data indicate that recurrent glucose oscillations promote oxidative stress, inflammatory signaling, and fibrogenic activation, while observational studies have reported associations between short- and long-term GV and MASLD-related phenotypes in diverse populations. The aim of this review is to describe the mechanistic links between insulin resistance, GV, and MASLD, summarize the current clinical and population evidence evaluating GV in this context, and identify key methodological and conceptual gaps that should inform future research.
Metabolic dysfunction-associated steatotic liver disease (MASLD) has become one of the leading causes of chronic liver disease (CLD) worldwide, reflecting the global increase in obesity, type 2 diabetes mellitus (T2DM), and metabolic syndrome (MetS) [1–3]. Previously referred to as non-alcoholic fatty liver disease (NAFLD), the redefinition of MASLD emphasizes the central role of metabolic dysfunction and highlights the liver as a key organ in systemic glucose and lipid homeostasis [1]. MASLD is closely linked to cardiometabolic risk factors, including insulin resistance (IR), obesity, dyslipidemia, and hypertension, which together drive the onset and progression of the disease [2, 4]. Among these associations, the relationship between MASLD and T2DM is particularly notable for its bidirectional nature: most people with T2DM develop hepatic steatosis, while MASLD itself confers an increased risk of developing T2DM [5, 6]. Moreover, studies have demonstrated that T2DM independently increases the risk of CLD and hepatocellular carcinoma (HCC) [7, 8].
In this context, understanding how alterations in glucose homeostasis translate into progressive liver injury is essential to unraveling the pathophysiology of MASLD. Although the underlying mechanisms of the disease are multifactorial, IR represents a fundamental mechanism through which metabolic dysfunction promotes hepatic lipid accumulation, inflammation, and fibrogenesis [2, 9, 10]. IR contributes to enhanced lipolysis, increased hepatic de novo lipogenesis, and impaired insulin signaling, thereby fostering hepatic steatosis and progression toward more advanced stages such as steatohepatitis and fibrosis [11, 12]. However, there is growing evidence suggesting that glucose dysregulation in MASLD goes beyond sustained hyperglycemia and IR. Glycemic variability (GV), defined as short-term fluctuations in glucose levels independent of mean blood glucose, has been revealed as an additional and clinically relevant metabolic stressor [13–16]. Glucose oscillations can trigger oxidative stress, activate proinflammatory pathways, and disrupt cellular homeostasis, thereby creating a biological environment favorable to hepatocellular injury and fibrogenesis, even in the absence of overt diabetes [17, 18]. Additionally, these fluctuations appear to exacerbate mitochondrial dysfunction and lipid peroxidation, mechanisms that may accelerate the transition from simple steatosis to steatohepatitis [13, 19]. Therefore, GV may represent a complementary metabolic stressor to IR, providing a more dynamic view of glucose homeostasis in MASLD. Conventional markers of glycemic control, such as glycated hemoglobin (HbA1c), reflect average blood glucose levels over time, but they have significant limitations in patients with advanced liver disease, in whom altered erythrocyte turnover and hypersplenism can compromise their accuracy [16]. Within this context, continuous glucose monitoring (CGM) has become a powerful tool for capturing GV and characterizing those variations in real time. Beyond its established role in optimizing diabetes control, CGM offers a unique opportunity to explore how glucose dynamics influence hepatic metabolism and disease progression in MASLD [20, 21]. This review examines the interaction between IR, GV, and MASLD, focusing on their mechanical interconnections and clinical implications. By integrating current evidence, we aim to clarify how these metabolic alterations contribute to disease development and progression.
Under physiological conditions, the liver and adipose tissue work together to maintain systemic homeostasis of glucose and lipids. The liver maintains plasma glucose levels through a finely regulated balance between glucogenesis, glycogenolysis, and gluconeogenesis, processes that are primarily governed by insulin and glucagon signaling [22, 23]. In the postprandial state, insulin promotes hepatic glycogen synthesis and suppresses endogenous glucose production, while stimulating lipogenesis through the activation of key transcription factors, such as sterol regulatory element-binding protein 1c (SREBP-1c) and carbohydrate-responsive element-binding protein (ChREBP). In contrast, during fasting, glucagon and catecholamines stimulate glycogen breakdown and gluconeogenesis to ensure adequate glucose availability for peripheral tissues [24]. Adipose tissue promotes this metabolic balance by storing excess energy in the form of triglycerides when food is ingested and releasing free fatty acids (FFAs) through lipolysis. Insulin exerts a potent antilipolytic effect by inhibiting hormone-sensitive lipase (HSL); however, in states of insulin deficiency or resistance, this regulatory control is lost. Uncontrolled lipolysis leads to excessive release of FFAs into the circulation, providing an abundant substrate for hepatic β-oxidation and triglyceride synthesis [25, 26]. The interaction between adipose tissue and the liver is also mediated by adipokines such as leptin and adiponectin, which modulate insulin sensitivity, lipid turnover, and inflammatory signaling [27]. Collectively, these processes confer metabolic flexibility, enabling efficient transitions between anabolic and catabolic states. Disruption of this coordinated regulation underlies the metabolic rigidity characteristic of IR and sets the stage for the development of MASLD [10].
Within this context, insulin emerges as the dominant hormonal regulator of nutrient metabolism, coordinating glucose uptake, lipid storage, glycogen, and protein synthesis in multiple tissues [28]. When insulin signaling is impaired, the resulting IR constitutes the central pathogenic link between obesity, T2DM, and MASLD. Chronic low-grade inflammation further amplifies IR by disrupting glucose and lipid regulation, attenuating tissue responsiveness to metabolic signals, and perpetuating systemic metabolic dysfunction [29]. In people with obesity or T2DM, IR increases adipose tissue lipolysis, which increases FFAs flow to the liver and, at the same time, promotes hepatic de novo lipogenesis [30]. This excess of FFAs is an important determinant of hepatic steatosis, as approximately 60% of the intrahepatic lipid content in MASLD comes from adipose tissue lipolysis, with additional contributions from de novo lipogenesis and dietary fat [31]. Hutchison et al. [32] proposed that MASLD should be considered as the hepatic manifestation of systemic endocrine and metabolic dysfunction, with IR acting as the initial lesion that drives triglyceride deposition in the liver, perpetuates inflammation, and disease progression. Of note, despite reduced insulin sensitivity, compensatory hyperinsulinemia maintains and exacerbates hepatic lipogenesis, promoting triglyceride accumulation and the generation of lipotoxic intermediates that induce oxidative stress and inflammatory signals [33].
The metabolic consequences of IR in MASLD extend far beyond the liver, supporting the concept of MASLD as a systemic disorder of metabolic communication between organs (Figure 1). Rather than arising from isolated liver dysfunction, steatosis in MASLD reflects coordinated metabolic alterations in multiple organs [31]. Skeletal muscle, the primary site of insulin-stimulated glucose disposal, is a critical determinant of this systemic metabolic imbalance [34]. Chakravarthy et al. [35] demonstrated that reduced insulin sensitivity in skeletal muscle impairs glucose disposal, leading to compensatory hyperinsulinemia and increased hepatic lipogenesis, while adipose tissue dysfunction increases the flow of FFAs to the liver. This redistribution of carbohydrate and lipid substrates amplifies hepatic metabolic stress and promotes triglyceride accumulation.
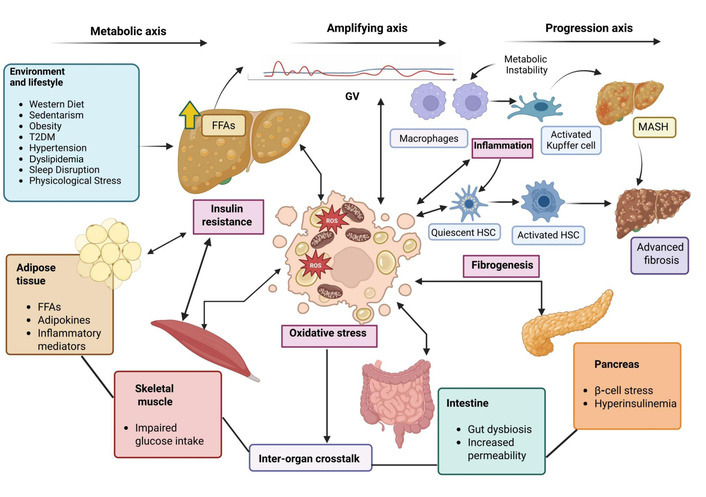
Pathophysiological framework linking insulin resistance (IR) and glycemic variability (GV) to MASLD progression. Environmental and lifestyle factors promote systemic IR, which causes lipolysis of adipose tissue with an increase in the release of free fatty acids (FFAs), adipokines, and inflammatory mediators that enhance lipid accumulation in the liver. Impaired glucose uptake in skeletal muscle contributes to hyperglycemia and metabolic instability. Stress on pancreatic β-cells and compensatory hyperinsulinemia further reinforce metabolic dysregulation. Intestinal dysbiosis and increased intestinal permeability alter the signaling of gut-derived metabolites and facilitate exposure to inflammatory microbial products, exacerbating hepatic IR. GV increases reactive oxygen species (ROS) production and oxidative stress, promoting inflammatory activation of macrophages and Kupffer cells. Persistent inflammation drives hepatic stellate cell (HSC) activation, fibrogenesis, and progression from steatosis to metabolic dysfunction-associated steatohepatitis (MASH) and advanced fibrosis.
Among the organs involved in this altered metabolic network, adipose tissue dysfunction contributes substantially to the pathogenesis of MASLD through the altered secretion of adipokines and inflammatory mediators [10]. Reduced adiponectin levels, increased leptin concentrations, and increased production of proinflammatory cytokines, such as tumor necrosis factor alpha (TNF-α), interleukin-6 (IL-6), and IL-1β, worsen both systemic and hepatic IR, while promoting hepatic inflammation and fibrogenesis [36]. Particularly, visceral adipose tissue has a proinflammatory phenotype, characterized by increased cytokine release and decreased adiponectin secretion, which further reinforces states of IR. At the same time, IR alters FFA metabolism by increasing HSL activity and modifying lipoprotein lipase (LPL) function, leading to increased lipolysis and elevated circulating FFAs levels. The resulting increase in plasma FFAs increases lipid entry into the liver and accelerates intrahepatic triglyceride accumulation [30].
In addition, the liver actively participates in metabolic communication between organs through the secretion of hepatokines. In the steatotic state, the hepatic secretory profile shifts toward molecules that directly modulate systemic insulin signaling and inflammation. Several hepatokines, including fetuin-A, fetuin-B, retinol-binding protein 4 (RBP4), leukocyte cell-derived chemotaxin 2 (LECT2), and hepassocin, impair insulin action by activating inflammatory and stress pathways such as toll-like receptor 4 (TLR4), c-Jun N-terminal kinase (JNK), and nuclear factor kappa-B (NF-κB) signaling, while enhancing hepatic gluconeogenesis and peripheral IR. In contrast, protective mediators such as adropin and sex hormone-binding globulin (SHBG) decrease, while fibroblast growth factor 21 (FGF21) increases as a compensatory response to metabolic stress, promoting glucose uptake by adipose tissue, lipid oxidation, and adiponectin signaling [37]. Human studies further support this endocrine interaction. Circulating levels of fetuin-B have been found to correlate with hepatic steatosis and tissue-specific insulin sensitivity, and to decrease following diet-induced weight loss, in parallel with improvements in adipose insulin response. Fetuin-B is particularly associated with insulin-mediated suppression of lipolysis, indicating that steatotic liver may directly influence the release of FFAs from adipose tissue. Through these mechanisms, hepatic secretory signals promote increased lipolysis and elevated circulating FFA flow, which enhances lipid supply to the liver and perpetuates hepatic triglyceride accumulation and systemic IR [38]. Additionally, experimental evidence suggests that fetuin-B acts as an active metabolic mediator rather than a passive marker of steatosis. Alterations in the hepatocyte secretome induced by lipid accumulation impair insulin-stimulated glucose uptake in skeletal muscle and reduce insulin-mediated suppression of hepatic gluconeogenesis. In animal models, reduction of circulating fetuin-B improves glucose tolerance independently of body weight, indicating a direct contribution to dysglycemia and early metabolic inflexibility associated with MASLD [39].
Interaction with the intestine further amplifies these processes, as gut-derived metabolites and alterations in colonic gene expression related to glucose and lipid metabolism modulate adipose tissue insulin sensitivity and hepatic steatosis [40]. Among these mediators, short-chain fatty acids (SCFAs) generated through bacterial fermentation of dietary fiber act as endocrine-like signaling molecules that connect the microbiota to peripheral metabolic tissues [41]. After absorption in the colon, SCFAs enter the portal and systemic circulation and interact with adipocytes via the FFA receptors FFAR2 (GPR43) and FFAR3 (GPR41). Activation of these pathways suppresses adipose tissue lipolysis, increases adiponectin secretion, improves insulin signaling, and increases lipid buffering capacity, reducing the flow of FFAs to the liver [42].
Nevertheless, in dysbiosis, the production and signaling of SCFAs are impaired. Reduced fiber fermentation, changes in microbial composition, and increased intestinal permeability decrease the availability of beneficial SCFAs and promote portal exposure to inflammatory microbial products [41]. This disrupts the metabolic regulation of adipose tissue, increases circulating FFAs, and promotes hepatic metabolic stress. At the same time, reduced hepatic AMP-activated protein kinase (AMPK) activity and inflammatory signaling promote gluconeogenesis and de novo lipogenesis [43]. These alterations directly affect glucose homeostasis. Inflammatory signaling triggered by microbial products, including lipopolysaccharide (LPS)-mediated activation of TLR4, interferes with insulin receptor substrate (IRS)-1/2 and phosphatidylinositol 3-kinase-protein kinase B (PI3K-Akt) pathways in the liver, muscles, and adipose tissue, reducing insulin-mediated glucose uptake and hindering the suppression of hepatic glucose production [44]. The resulting compensatory hyperinsulinemia maintains the activation of lipogenic transcription factors, such as SREBP-1c and ChREBP, creating a state of selective IR in which lipogenesis remains active while glucose metabolism is impaired, facilitating triglyceride accumulation in hepatocytes [45].
As metabolic overload and IR persist in all organs, inflammatory signaling emerges as a central amplifier linking metabolic stress to progressive liver injury in MASLD. Low-grade chronic inflammation arises from IR and perpetuates it, creating a self-reinforcing loop that links metabolic dysregulation with fibrogenic activation [46]. This inflammatory environment is driven by the coordinated actions of adipose tissue, immune cells, and the liver, and represents a key determinant of disease progression [47]. Proinflammatory cytokines released by adipose tissue and Kupffer cells, TNF-α and IL-6, promote hepatocellular injury and activate hepatic stellate cells (HSCs), the primary mediators of fibrosis. Through TLR and NF-κB signaling pathways, HSCs integrate metabolic and inflammatory signals, driving extracellular matrix (ECM) deposition and tissue remodeling [48]. HSC activation is further sustained by TNF-α and adipokine imbalance, creating a feed-forward loop of fibrosis [49]. The convergence of these inflammatory mediators on shared fibrogenic signaling networks emphasizes the importance of inflammation linked to IR as a factor in the development of MASLD [50]. Chronic low-grade inflammation represents a critical mechanistic link between IR and progressive MASLD. Inflammatory mediators play a pivotal role in MASLD progression. TNF-α and IL-6, predominantly released from the adipose tissue and activated Kupffer cells, promote IR and hepatic inflammation [4, 51, 52]. These cytokines impair insulin signaling through serine phosphorylation of IRS, further aggravating metabolic dysfunction.
Within the hepatic microenvironment, sustained exposure to inflammatory mediators, lipotoxicity, and reactive oxygen species (ROS) promotes activation of HSCs. Activated HSCs undergo transdifferentiation into collagen-producing myofibroblast-like cells, leading to ECM deposition and fibrogenesis. Adipokines such as adiponectin and leptin also contribute to modulating hepatic lipid metabolism and fibrogenesis [4, 53]. Chronic exposure to these mediators activates HSCs, driving fibrogenic responses and progression toward fibrosis and cirrhosis [2, 4, 54]. The predominance of profibrogenic and proinflammatory stimuli in insulin-resistant states accelerates fibrosis progression and worsens clinical outcomes in MASLD.
Additional molecular pathways, including transforming growth factor-β (TGF-β) signaling is identified as a central network in HSC activation and ECM deposition. Upon liver injury and inflammation, TGF-β is upregulated, leading to the transdifferentiation of quiescent HSCs into myofibroblast-like cells, thereby driving fibrosis [2]. Another pathway is Notch signaling. Notch-induced osteopontin acts as a profibrogenic mediator, amplifying the activation of HSCs and promoting ECM accumulation [2]. Remarkably, HSCs themselves are active participants in hepatic inflammation, producing cytokines and chemokines that recruit immune cells and perpetuate the inflammatory milieu. This crosstalk between HSCs, hepatocytes, and immune cells is a key driver of the progression from steatosis to metabolic dysfunction-associated steatohepatitis (MASH) and fibrosis in MASLD.
In the context of systemic IR, interorgan metabolic dysfunction, and chronic inflammation, GV has emerged as a dynamic and biologically relevant component of glucose dysregulation in MASLD. Unlike conventional measures that reflect mean blood glucose, GV captures the magnitude and frequency of glucose fluctuations, both at short and long term, providing an insight into the instability of glucose homeostasis that may independently contribute to liver injury [15, 17, 55]. Short-term GV includes intraday and inter-day glucose variations, which reflect rapid fluctuations caused by eating and fasting cycles, insulin secretion, and tissue sensitivity to insulin. Long-term GV reflects variability in glycemic control assessed over extended periods, distinct from mean glycemia [56]. This distinction is particularly relevant in MASLD, where recurrent glucose oscillations act as metabolic stressors that amplify oxidative stress, inflammatory signaling, and fibrogenic activation, even in the absence of sustained hyperglycemia [18]. By capturing metabolic instability rather than cumulative glucose exposure alone, GV provides a complementary framework to IR for understanding glucose-related liver injury and disease progression [13].
Beyond sustained hyperglycemia, recurrent glucose oscillations exert distinct and disproportionately harmful effects on hepatocytes (Figure 2). Accumulated experimental and clinical evidence indicates that GV acts as an active metabolic stressor capable of inducing hepatocellular injury through mechanisms that go beyond simple chronic metabolic overload. These effects are primarily mediated by exaggerated oxidative stress, mitochondrial dysfunction, and the activation of stress-sensitive inflammatory signaling pathways [54, 57, 58]. Acute glucose fluctuations promote excessive generation of ROS within hepatocytes by disrupting mitochondrial electron transport and activating nicotinamide adenine dinucleotide phosphate (NADPH) oxidase. Compared to stable hyperglycemia, intermittent glucose variations induce larger and faster oxidative bursts, leading to lipid peroxidation, mitochondrial uncoupling, deficient adenosine triphosphate (ATP) synthesis, and loss of cellular energy homeostasis [59, 60].
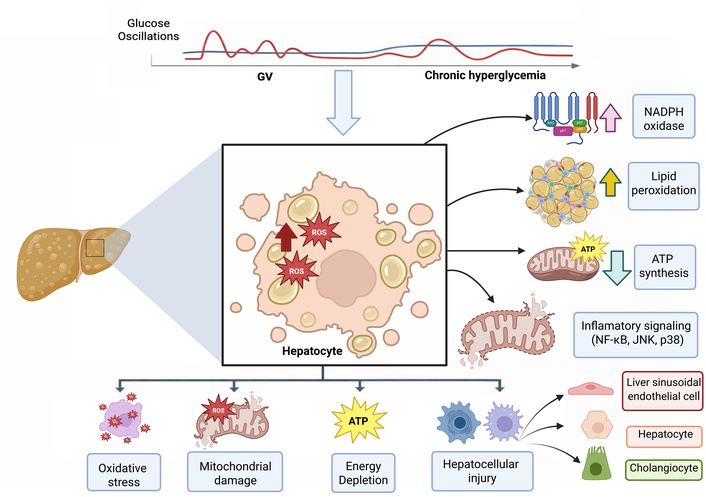
Converging mechanisms between insulin resistance, glycemic variability (GV), and metabolic instability contribute to the development of metabolic dysfunction-associated steatohepatitis (MASH) and advanced fibrosis. Initial metabolic axis: environmental and lifestyle factors [western diet, sedentary behavior, obesity, type 2 diabetes mellitus (T2DM), dyslipidemia, hypertension, sleep disturbances, and psychosocial stress] promote systemic and hepatic insulin resistance. Insulin resistance in adipose tissue increases lipolysis and the flux of free fatty acids (FFAs) to the liver, whereas skeletal muscle insulin resistance reduces glucose uptake, thereby favoring hyperglycemia and hepatic de novo lipogenesis. Amplifying axis: GV, characterized by recurrent glucose excursions, acts as a potent amplifier of hepatocellular injury by inducing oxidative stress, excessive generation of reactive oxygen species (ROS), activation of macrophages and Kupffer cells, and inflammatory signaling mediated by nuclear factor kappa-B (NF-κB) and proinflammatory cytokines. Concomitantly, activation of the advanced glycation end product (AGE)-RAGE signaling pathway and hepatic stellate cell (HSC) activation promote fibrogenesis. Progression axis: persistent metabolic instability, characterized by sustained insulin resistance, chronic GV, dyslipidemia, and adipokine imbalance, drives the transition from hepatic steatosis to MASH and progression toward advanced fibrosis. These processes are further reinforced by intense inter-organ crosstalk involving adipose tissue, skeletal muscle, the intestine, and the pancreas, thereby establishing a vicious cycle of inflammation, hepatocellular injury, and progressive fibrogenesis.
At the mitochondrial level, GV impairs the efficiency of oxidative phosphorylation and compromises mitochondrial quality control. Repeated glucose oscillations exacerbate mitochondrial fragmentation, reduce membrane potential, and impair antioxidant defenses, amplifying oxidative damage and promoting hepatocyte dysfunction [58]. In parallel, recurrent oxidative stress activates stress-responsive signaling cascades, such as NF-κB and JNK, leading to increased transcription of proinflammatory mediators such as TNF-α and IL-6 [61].
Importantly, the cellular effects of GV also differ mechanistically from those induced by chronic hyperglycemia. While sustained hyperglycemia primarily causes liver damage due to prolonged metabolic excess, non-enzymatic glycation of proteins, and accumulation of advanced glycation end products (AGEs), it does not cause acute oxidative or inflammatory responses of the same magnitude as rapid glucose fluctuations [54, 62]. In contrast, intermittent glucose variations trigger transient but intense episodes of oxidative and inflammatory stress that accumulate over time, even when average glucose levels remain comparable [14]. Repeated glucose oscillations also contribute to the phenomenon of metabolic memory, whereby brief periods of dysglycemia induce persistent alterations in redox regulation, mitochondrial function, and gene expression. These changes maintain hepatocellular susceptibility to injury despite subsequent normalization of glucose levels, thereby perpetuating liver damage in MASLD [63]. Through these mechanisms, GV emerges as a key factor in hepatocellular injury that acts independently and synergistically with IR and chronic hyperglycemia.
Beyond its direct hepatocellular effects, GV plays a key role in fibrogenic remodeling across the MASLD spectrum (Figure 3). Recurrent glucose oscillations amplify hepatic oxidative stress and inflammatory signaling, creating a microenvironment that favors sustained activation of non-parenchymal cells, particularly Kupffer cells and HSCs, the main mediators of hepatic fibrosis [13, 59]. Acute glucose fluctuations increase the generation of ROS and promote the formation of AGEs. The binding of AGEs to their receptor (RAGE) in Kupffer cells activates proinflammatory and profibrotic signaling pathways, leading to increased secretion of cytokines such as TNF-α, IL-1β, and TGF-β1 [64].
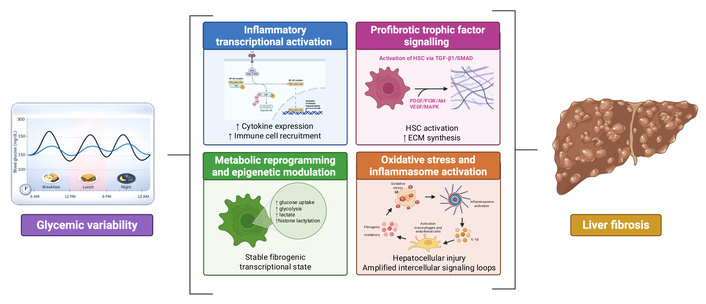
Mechanistic pathways linking glycemic variability to fibrogenic remodeling in MASLD. Fluctuating glucose exposure amplifies hepatic oxidative stress and inflammatory signaling, creating a permissive microenvironment for sustained activation of non-parenchymal cells, particularly Kupffer cells and hepatic stellate cells (HSCs). Additionally, promote the generation of reactive oxygen species (ROS) and the formation of advanced glycation end products (AGEs), activating RAGE-dependent inflammatory cascades and stress-sensitive kinases, which converge on nuclear factor kappa-B (NF-κB)-mediated transcription of proinflammatory cytokines. These signals enhance the recruitment and activation of hepatic macrophages and reinforce profibrotic interaction. At the same time, trophic and cytokine signaling pathways, including TGF-β1/SMAD, PI3K/Akt/mTOR, MAPK, PDGF, and VEGF, drive HSC activation, proliferation, and extracellular matrix (ECM) deposition. Glycemic variability also induces metabolic reprogramming within HSCs, characterized by increased glycolysis and lactate production, which promotes fibrogenesis through epigenetic mechanisms such as histone acetylation. In parallel, NOD-like receptor protein 3 (NLRP3) inflammasome activation driven by oxidative stress amplifies IL-1β-dependent intercellular signaling, reinforcing hepatocellular injury and fibrotic progression. Together, these interconnected pathways provide a mechanistic framework by which glycemic instability promotes liver fibrosis across the MASLD spectrum.
At the cellular level, glucose variations cause repeated increases in ROS production. AGE-RAGE signaling driven by hyperglycemia acts as an upstream molecular trigger that activates stress-sensitive kinases, including JNK and p38 mitogen-activated protein kinase (MAPK). In parallel, oxidative stress promotes the nuclear translocation of NF-κB, a redox-sensitive transcription factor that functions as a cellular sensor of metabolic injury. NF-κB activation induces the transcription of proinflammatory cytokines and prooxidant enzymes, establishing a positive feedback inflammatory loop that maintains liver injury. Through paracrine signaling, these mediators recruit and activate Kupffer cells and infiltrated monocyte-derived macrophages, directly linking recurrent glucose spikes with intrahepatic inflammatory activation [65, 66].
HSCs are the principal effector cells in liver fibrosis. GV-associated inflammatory signals, including TNF-α and IL-6, upregulate expression of TGF-β1, a regulator of fibrosis that orchestrates both canonical and non-canonical signaling in HSCs. Canonically, TGF-β1 binds to serine/threonine kinase receptors, leading to phosphorylation of SMAD2/3 and formation of SMAD2/3-SMAD4 complexes that translocate to the nucleus to drive transcription of collagen type I (COL1A1), α-smooth muscle actin (α-SMA), and tissue inhibitors of metalloproteinases (TIMPs). Non-canonical TGF-β1 signaling involves PI3K/Akt/mTOR and MAPK pathways, which further support myofibroblast-like cells transformation and fibrogenic gene expression [65]. In addition to TGF-β1, platelet-derived growth factor (PDGF) and vascular endothelial growth factor (VEGF) contribute to HSC proliferation and survival through PDGFR-β-mediated activation of PI3K/Akt and extracellular signal-regulated kinase (ERK)/MAPK cascades. These pathways sustain the activated HSC phenotype, amplify ECM production, and enhance cell migration and tissue contraction [67]. On the other hand, GV influences intracellular metabolism in HSCs themselves. Recent studies demonstrate that glycolytic reprogramming within HSCs promotes fibrogenesis by increasing expression of glucose transporters (GLUTs) such as GLUT1 and glycolytic enzymes such as hexokinase 2 (HK2), pyruvate kinase M2 (PKM2), and phosphofructokinase-FBP3 (PFKFB3). This metabolic shift not only supports the bioenergetic demand of activated HSCs but also drives profibrotic gene expression through epigenetic mechanisms. For example, glycolysis-derived lactate induces histone acetylation on promoter regions of key fibrogenic genes, including SRY-box transcription factor 9 (SOX9), thereby facilitating sustained transcriptional activation of fibrotic programs [68]. The link between metabolic reprogramming and epigenetic regulation underscores how glycemic dynamics translate into durable transcriptional changes that perpetuate fibrogenesis independent of the initial metabolic insult.
GV-induced oxidative stress also engages innate immune sensors such as the NOD-like receptor protein 3 (NLRP3) inflammasome. Accumulation of ROS and damage-associated molecular patterns (DAMPs) from stressed hepatocytes promotes assembly of the NLRP3 inflammasome, leading to caspase-1 activation and IL-1β release. IL-1β further stimulates both hepatocytes and non-parenchymal cells, such as macrophages and endothelial cells, to produce fibrogenic mediators, reinforcing the cycle of injury, inflammation, and fibrosis [69]. Although direct GV modulation of NLRP3 in MASLD has yet to be fully delineated in vivo, the pathway is a critical node integrating oxidative stress and inflammation in fibrotic progression.
Accurate assessment of glucose metabolism is essential in MASLD to identify concomitant metabolic diseases and for risk stratification and prognosis assessment [70]. However, conventional glycemic markers were developed primarily for the diagnosis and management of diabetes and may not adequately reflect the dynamic metabolic alterations that characterize MASLD [16, 71]. Traditional indices, such as fasting plasma glucose (FPG), homeostasis model assessment of IR (HOMA-IR), and HbA1c, continue to be widely used in both clinical practice and research (Table 1) [72–75]. FPG and HOMA-IR provide estimates of basal glucose and insulin homeostasis and are useful for identifying overt dysglycemia and systemic IR. However, these measures represent static snapshots and do not capture postprandial variations or short-term glucose fluctuations that may contribute to liver injury. In addition, HOMA-IR is an indirect estimate of insulin sensitivity, and its accuracy is influenced by the variability of insulin assays and fasting conditions [76–81]. Similarly, HbA1c reflects average blood glucose levels over approximately 8–12 weeks and is the cornerstone of long-term glycemic assessment in diabetes. However, its reliability may be compromised in patients with CLD, including MASLD, due to altered erythrocyte turnover, anemia, iron deficiency or supplementation, hypersplenism, use of erythropoiesis-stimulating agents, and chronic inflammation [82]. Collectively, these limitations highlight that glucose dysregulation in MASLD cannot be fully captured by point or average measurements and that the temporal pattern of blood glucose deserves specific consideration. In this context, GV has emerged as a complementary dimension of glucose assessment, reflecting fluctuations in glucose levels over time and potentially having independent prognostic relevance [17].
Comparison of glycemic and IR assessment methods.
| Method | Purpose | Sample type | Time period reflected | Advantages | Limitations | Clinical use | Cost and accessibility |
|---|---|---|---|---|---|---|---|
| Fasting plasma glucose (FPG) | Diagnose hyperglycemia and screen for diabetes or impaired fasting glucose | Venous blood (fasting) | Single time point (basal glycemia) | Simple, inexpensive, widely available; standardized diagnostic thresholds | Does not capture postprandial excursions or glycemic variability; limited sensitivity for early dysglycemia; influenced by acute stress or illness | Initial screening and diagnosis of diabetes; routine metabolic assessment | Very low cost; universally accessible |
| Homeostasis model assessment of insulin resistance (HOMA-IR) | Estimate IR | Venous blood (fasting glucose + fasting insulin) | Single time point (fasting state) | Simple surrogate of IR; useful in epidemiological studies | Not validated for individual clinical decision-making; influenced by insulin assay variability; limited interpretability across populations | Research and population studies: an adjunct marker of IR | Low–moderate cost; insulin assays may limit availability |
| Glycated hemoglobin (HbA1c) | Assess long-term average glycemic exposure; diagnose and monitor diabetes | Venous blood | 8–12 weeks (integrated mean glycemia) | Well standardized; no fasting required; predictive of microvascular complications in diabetes | Does not reflect short-term glucose fluctuations, postprandial hyperglycemia, or hypoglycemia; similar HbA1c values may mask heterogeneous glucose profiles | Diagnosis and monitoring of diabetes; risk stratification based on average glycemia | Low–moderate cost; widely available |
| Oral glucose tolerance test (OGTT) | Detect impaired glucose tolerance and characterize post-load glycemic response | Venous blood (fasting and post-glucose load) | Short-term dynamic response (0–120 minutes, sometimes extended) | Sensitive to early dysglycemia; captures postprandial hyperglycemia not seen with FPG or HbA1c; enables derivation of insulin secretion and sensitivity indices | Time-consuming; poor reproducibility; influenced by acute factors (diet, activity, illness); limited reflection of day-to-day glycemic patterns; impractical for routine follow-up | Diagnosis of impaired glucose tolerance and diabetes in selected cases; metabolic phenotyping in research | Glucose tolerance and diabetes in selected cases; metabolic phenotyping in researchModerate cost; available but limited by logistics |
| Continuous glucose monitoring (CGM) | Characterize real-time glucose dynamics and glycemic variability | Interstitial glucose via subcutaneous sensor | Minutes to days or weeks (diurnal and short-term patterns) | Captures postprandial excursions, nocturnal hypoglycemia, and glycemic variability; identifies “hidden” dysglycemia despite normal HbA1c; high temporal resolution | Higher cost; limited access in some settings; requires technical expertise and patient adherence; clinical thresholds outside diabetes are not fully established | Selected patients with suspected glycemic instability, discordant conventional markers, or for metabolic phenotyping, research applications | High cost; accessibility varies by health system |
GV can be assessed using both intermittent laboratory-based measurements and continuous monitoring approaches. Long-term or visit-to-visit GV has been evaluated using repeated measurements of FPG or HbA1c over time, with metrics such as standard deviation (SD) or coefficient of variation (CV), and has been associated with adverse cardiometabolic and hepatic outcomes [62, 83]. However, these approaches primarily capture long-term variability and lack the sensitivity to detect short-term glucose oscillations and daily variations that may act as acute metabolic stressors [84]. In this context, CGM has become a highly effective tool for the dynamic assessment of glucose dysregulation. CGM systems measure interstitial glucose concentrations at frequent intervals, allowing for detailed characterization of glucose trends over time. Beyond average glucose levels, CGM allows GV to be quantified using clinically relevant metrics such as time in range (TIR), time above or below range, CV, mean of daily differences (MODD), and mean amplitude of glycemic excursions (MAGE). Importantly, CGM can detect asymptomatic hyperglycemic and hypoglycemic episodes that are not captured by conventional laboratory tests, providing a more comprehensive representation of glucose instability [85, 86]. By uncovering dynamic glucose disturbances that may remain obscured despite apparently acceptable mean glycemic values, CGM-based assessment of GV complements traditional markers of glucose control [71]. As evidence increasingly links GV to liver disease severity and adverse cardiometabolic outcomes, integration of dynamic glucose monitoring into the clinical evaluation of MASLD holds promise for improving patient phenotyping, prognostic stratification, and therapeutic decision-making [21].
GV has been consistently associated with adverse outcomes in cardiometabolic diseases, including increased cardiovascular events and all-cause mortality, underscoring the instability of glucose as a clinically relevant modifier of long-term risk, independent of mean glycemic exposure [84, 87–89]. Importantly, evidence is also expanding to individuals without diabetes; in a systematic review and meta-analysis of CGM-based studies, Hjort et al. [90] reported that short-term GV is consistently higher in prediabetes, apparently related to impaired β-cell function, while showing less consistent associations with adiposity and traditional cardiometabolic risk factors, and overall there is no clear relationship with markers of steatotic liver disease; however, GV was associated with measures of coronary atherosclerosis development and may predict cardiovascular events and incident T2DM, although prospective data remain limited. In this broader context, MASLD represents a condition in which metabolic dysregulation, liver injury, and cardiovascular risk converge, creating an environment in which GV may have prognostic significance [16]. Cardiovascular disease (CVD) is the leading cause of mortality in MASLD, surpassing liver-related complications and highlighting the close interaction between hepatic steatosis, IR, and systemic cardiometabolic risk [91]. Rather than representing independent comorbidities, MASLD and CVD appear to arise from a shared metabolic-inflammatory environment. The accumulation of hepatic lipids promotes the systemic release of hepatokines, cytokines, and proatherogenic mediators that extend beyond the liver and influence vascular function [92]. In parallel, IR and GV increase oxidative stress and AGE-related signaling, contributing to endothelial activation and impaired vascular homeostasis [93]. These vascular alterations help explain why cardiovascular complications often accompany the progression of MASLD. Endothelial dysfunction, together with chronic low-grade inflammation and atherogenic lipid profiles, promotes the acceleration of atherosclerosis, myocardial remodeling, and electrical instability. In patients with concomitant T2DM, impaired metabolic flexibility and persistent glycemic fluctuations further exacerbate vascular injury, even when mean blood glucose appears to be controlled. In this context, the severity of liver damage takes on systemic relevance. Progressive liver injury maintains inflammatory and oxidative signaling that extends beyond the liver, contributing to persistent vascular dysfunction. Consequently, liver fibrosis may reflect the accumulated metabolic and inflammatory burden rather than isolated liver damage [94, 95].
Among specific liver determinants, the stage of fibrosis is the strongest predictor of adverse outcomes, including liver-related events, cardiovascular morbidity, and overall mortality [96, 97]. Patients with advanced fibrosis have substantially higher rates of cardiovascular events, supporting the concept that fibrosis reflects accumulated metabolic and inflammatory burden rather than isolated liver pathology [98]. Consistently, biopsy-confirmed histological evidence of MASLD and MASH indicates that poorer chronic glycemic control, as assessed by pre-biopsy mean HbA1c, is independently associated with hepatocyte ballooning and more advanced fibrosis, regardless of diabetes status, highlighting glycemic exposure as a prognostic determinant of liver injury [99].
Emerging clinical evidence suggests that GV may act as an additional risk marker across the MASLD continuum (Table 2 summarizes the available clinical and population-based studies). At the population level, greater variability in FPG between visits has been independently associated with the incidence of MASLD in large cohorts without baseline liver disease, even after adjusting for mean glucose and conventional metabolic risk factors [15]. Complementing FPG-based analyses, long-term HbA1c variability has also been linked to the development of MASLD. In a longitudinal cohort spanning from normal glucose tolerance to established diabetes, a higher mean HbA1c increased the risk of MASLD across the glycemic spectrum, while HbA1c variability between visits independently predicted MASLD only among individuals with established diabetes, suggesting that glycemic instability becomes clinically relevant for liver risk primarily once diabetes is present [100]. CGM-derived evidence further refines this association by capturing daily glucose dynamics. In a CGM population study that quantified liver fat using magnetic resonance imaging (fat fraction by proton density), Zhong et al. [21] demonstrated that higher mean glucose values and GV metrics (including CV and excursion-based indices) were independently associated with greater severity of steatosis, with additional discriminatory value provided by diurnal versus nocturnal glucose profiles. These findings support the existence of a relationship between short-term glycemic instability and hepatic fat accumulation beyond mean blood glucose.
Clinical and population-based studies of glycemic variability in MASLD and CLD.
| Study | Country/Population | Sample size | Study design | Glycemic assessment | Main findings | Key limitations |
|---|---|---|---|---|---|---|
| Hashiba M et al. (2013) [14] | Japan | 169 patients underwent 75-g oral glucose tolerance test (OGTT) (fibrosis staged F0–F3 by biopsy); CGMS subgroup n = 20 (mild fibrosis F0–2 n = 10 vs. severe fibrosis F3–4 n = 10). | Cross-sectional observational study evaluating predictors of fibrosis severity using OGTT-derived metabolic parameters plus a CGM substudy with standardized inpatient diet. | 75-g OGTT (glucose/insulin at 0, 30, 60, 90, 120, 180 minutes), HbA1c, fasting insulin, HOMA-IR, insulinogenic index, 1,5-AG, AUC-PG, and AUC-IRI.CGM (≈ 30 hours) in a subset to quantify short-term glycemic variability: median glucose, SD of glucose, maximum glucose, and Δmin–max glucose (with standardized meals). | With increasing fibrosis stage (F0→F3), prevalence of T2DM increased, and NGT decreased; HbA1c and HOMA-IR rose while 1,5-AG declined.In multivariable logistic regression for advanced fibrosis (F3 vs. F0–2), lower 1,5-AG was the only independent factor (suggesting postprandial hyperglycemia/greater excursions not captured by fasting glucose alone).CGMS substudy showed markedly higher glycemic variability in severe fibrosis vs. mild fibrosis: higher SD, higher maximum glucose, and higher Δmin–max, with prominent postprandial hyperglycemia; minimum glucose did not differ significantly. | Single center; mostly cross-sectional (fibrosis severity, not prospective progression); CGM performed in a small subset (n = 20) and for a relatively short monitoring window; potential confounding by age/BMI (both increase with fibrosis); limited generalizability to treated diabetes (participants were not on antidiabetic drugs/insulin). |
| Honda F et al. (2018) [16] | Japan | 105 CLD patients with T2DM CH n = 51; LC n = 54; Child–Pugh A/B/C: 31/18/5. Most were on glucose-lowering therapy (87/105). | Single-center retrospective observational study; inpatient CGM with individualized fixed-calorie diets; cross-sectional analysis of glycemic variability metrics by liver functional reserve and by HbA1c strata. | CGM performed for 72 hours. Glycemic variability metrics included MBG, ΔBG (max–min glucose), MAGE, SD, and time spent above 140 mg/dL (AUC ≥ 140) and below 70 mg/dL (AUC < 70). Postprandial hyperglycemia was defined as a max glucose ≥ 200 mg/dL, nocturnal hypoglycemia as a nighttime min ≤ 70 mg/dL, and high MAGE as ≥ 77.4 mg/dL. | Across worsening hepatic functional reserve (CH→Child A→Child B/C), MBG and ΔBG increased significantly, and AUCgluc ≥ 140 rose stepwise, indicating greater hyperglycemic exposure with declining liver function, despite no clear differences in fasting glucose, insulin, or HOMA-IR across groups.Postprandial hyperglycemia was extremely common (92%), and nocturnal hypoglycemia occurred in 22%, even under inpatient monitoring. Importantly, among non-anemic patients with HbA1c < 7.0%, LC patients had a higher prevalence of high MAGE (≥ 77.4 mg/dL) and elevated MBG (> 145 mg/dL) than CH patients, demonstrating clinically meaningful “hidden” glycemic instability despite apparently acceptable HbA1c.In multivariable models, LC independently predicted higher MBG, and both LC and IR (HOMA-IR > 2.5) independently predicted high MAGE in the non-anemic HbA1c < 7% subgroup. | Retrospective cross-sectional design; no CLD non-diabetic comparator; inpatient setting and fixed diet may limit generalizability to free-living glycemic variability; heterogeneity of CLD etiologies not fully evaluated; LC partly defined using APRI > 1 when biopsy/imaging unavailable; treatment heterogeneity (multiple diabetes agents) may influence CGM patterns despite analyses suggesting no major differences by medication class. |
| Yoo JH et al. (2021) [100] | South Korea | 21,123 patients; NGT 12,838; prediabetes 6,650; diabetes 1,635. | Longitudinal cohort; ≥ 5 annual screening checkups; recruitment 2005–2016; median follow-up 57 months. | Visit-to-visit HbA1c variability derived from three consecutive HbA1c measurements. | Mean HbA1c was independently associated with incident MASLD across glycemic strata, with risk increasing from HbA1c ~4.9%, even in NGT.HbA1c visit-to-visit variability predicted incident MASLD only in participants with established diabetes, independent of mean HbA1c.The glycemic variability-MASLD association in diabetes was significant, particularly among those with an increasing post-baseline HbA1c.No significant association between HbA1c variability and incident NAFLD was observed in NGT or prediabetes. | Single-center; visit-to-visit variability based on only three HbA1c measurements. |
| Yoo JJ et al. (2021) [101] | South Korea | 674,178 patients with diabetes had ≥ 3 health examinations within 5 years prior to index (2009–2010). | Nationwide population-based longitudinal cohort; 1-year lag period; median follow-up 6.7 years. | Visit-to-visit FPG variability assessed across serial health examinations. | Higher visit-to-visit glycemic variability independently predicted incident HCC, with a clear dose-response relationship across glycemic variability quartiles.The highest glycemic variability quartile was associated with ~27% higher HCC risk compared with the lowest quartile, independent of baseline fasting glucose, diabetes duration, BMI, LC, viral hepatitis, alcohol intake, and other confounders.The association was consistent across all glycemic variability metrics and broadly across clinical subgroups. | Glycemic variability limited to long-term visit-to-visit FPG; HbA1c unavailable; limited fibrosis characterization; observational design; findings limited to patients with diabetes. |
| Hong SH et al. (2021) [15] | South Korea | 57,636 adults aged ≥ 45 years without T2DM or MASLD. | Nationwide population-based retrospective longitudinal cohort; ≥ 3 health examinations over 5 years. | Long-term visit-to-visit FPG variability was assessed by CV, SD, VIM, and ASV. | Higher long-term FPG variability was independently associated with incident MASLD, even after adjustment for mean FPG and cardiometabolic risk factors. Individuals in the highest quartile of FPG-CV had a 15% higher risk of MASLD compared with the lowest quartile. The association was consistent across all glycemic variability metrics and persisted in subgroup and sensitivity analyses. The effect was particularly pronounced in normal-weight individuals, suggesting that glycemic variability confers liver risk beyond adiposity and average glycemia. | Hepatic steatosis is defined using the fatty liver index rather than imaging or histology; liver fibrosis is not assessed. |
| Ogawa Y et al. (2022) [71] | Japan | 335 patients with CLD and glucose intolerance; CH 51%, cirrhosis (Child–Pugh A–C) 49%; diabetes in 76%. | Single-center observational cohort; inpatient evaluation; CGM performed between 2013–2017; cross-sectional analysis with external validation cohort (n = 231). | CGM over 72 hours; assessment of mean glucose, postprandial hyperglycemia, nocturnal hypoglycemia; estimated HbA1c derived from CGM mean glucose and compared with measured HbA1c. | CGM revealed substantial underestimation of glycemic burden by HbA1c in CLD, particularly with worsening hepatic functional reserve.As liver function declined, mean glucose levels and glycemic variability increased despite lower HbA1c values.CGM detected frequent postprandial hyperglycemia and nocturnal hypoglycemia not captured by fasting glucose or HbA1c.The discrepancy between CGM-derived estimated HbA1c and measured HbA1c widened progressively from CH to Child–Pugh C cirrhosis, leading to missed or delayed diabetes diagnosis in a substantial proportion of patients. | Cross-sectional design; CGM performed during hospitalization for liver dysfunction or liver cancer; no longitudinal liver or cardiovascular outcomes assessed; predominantly diabetic population; single-country cohort. |
| Zhou H et al. (2022) [102] | United States | 2,467 Black and White adults; aged 18–30 years at baseline (1985–1986); followed for 25 years; MASLD prevalence at midlife 9.8%. | Prospective population-based cohort; long-term follow-up over 25 years with repeated examinations. | Visit-to-visit FPG variability was assessed as CV, SD, and ARV across serial measurements. | Higher visit-to-visit FPG-glycemic variability in early adulthood was independently associated with prevalent MASLD in middle age, irrespective of mean fasting glucose levels.Participants in the highest quartile of FPG variability had a 2.8-to-3.8-fold higher odds of MASLD compared with the lowest quartile, consistent across CV, SD, and ARV metrics.These findings suggest that long-term glycemic instability, even within largely nondiabetic ranges, contributes to NAFLD risk later in life. | Steatosis was not measured at baseline, limiting temporality; relatively low MASLD prevalence; the cohort was limited to Black and White participants. |
| Zhong H et al. (2024) [21] | China | 1,180 participants (healthy n = 698; mild steatosis n = 242; moderate/severe steatosis n = 240). | Cross-sectional analysis (CGM worn for 2 weeks; liver MRI performed within a few days after CGM). | CGM-based glycemic assessment (2 weeks; blinded): mean glucose metrics, glycemic variability, and time-in-range metrics computed for all-day, daytime, and nighttime windows. | Higher mean glucose and higher short-term glycemic variability were independently associated with higher steatosis degree.Lower daytime TIR was linked to higher steatosis degree, while nighttime TIR showed the opposite-direction association in their models.Prediction models: nighttime and daytime CGM features outperformed all-day features for classifying moderate/severe steatosis; the combined day + night model performed best (AUROC ~0.73), and nighttime MODD emerged as the most important predictor. | Cross-sectional design; limited generalizability. |
| Barbieri E et al. (2025) [103] | United States | 27 youth with obesity (11 girls); median age 15 years; BMI percentile ~99th; racially/ethnically diverse (non-Hispanic Black and Hispanic reported). | Cross-sectional, mechanistic clinical study; 10-day blinded CGM plus 3-hour OGTT; liver fat quantified by MRI-PDFF. | Daily glucose variability by CGM (10 days): mean sensor glucose, SD (STDEV), and CV; complemented by OGTT-derived beta-cell function and insulin sensitivity. | Higher daily glycemic variability was associated with greater intrahepatic fat content, even when fasting glucose was not informative.Mean sensor glucose, STDEV, and CV each correlated with PDFF; youths meeting MASLD criteria (PDFF ≥ 5.5%) had higher average glucose and higher STDEV (and a trend toward higher CV).Glucose variability was also associated with lower insulin sensitivity and with indices of beta-cell responsiveness/insulin secretion, linking glycemic instability to early beta-cell compensation in obesity.Variability metrics related to post-load glycemia (2-hour OGTT glucose) and STDEV related to fasting plasma lactate. | Small sample size; cross-sectional design; limited generalizability. |
| Wang Y et al. (2025) [13] | China | 2,897 T2DM inpatients (1,057 T2DM + MASLD matched 1:1 with 1,057 T2DM without MASLD). | Retrospective age- and sex-matched case–control study (June 2019–March 2022). | Short-term glycemic variability derived from inpatient multi-point capillary glucose measurements (≥ 2 days): SD, CV, MAGE; HbA1c, FPG, 2-hour PG; IR and β-cell function assessed by HOMA-IR and HOMA-β. | Among T2DM patients, MASLD was associated with lower glycemic variability and lower hypoglycemia incidence, despite higher IR and hyperinsulinemia.The inverse association between glycemic variability and MASLD was consistent across BMI and HbA1c strata.Within the T2DM + MASLD group, higher fibrosis risk (FIB-4 ≥ 1.3) was associated with higher SD and MAGE, suggesting that glycemic variability increases with advancing liver disease severity.HbA1c was the strongest positive determinant of glycemic variability, whereas postprandial C-peptide showed a negative association with glycemic variability, supporting a role of hyperinsulinemia in dampening glucose fluctuations. | Retrospective single-center inpatient cohort; MASLD diagnosed by ultrasound; glycemic variability derived from capillary glucose; lack of detailed data on diabetes duration and antidiabetic medication. |
1,5-AG: 1,5-anhydroglucitol; ARV: average real variability; ASV: average successive variability; BMI: body mass index; CGM: continuous glucose monitoring; CH: chronic hepatitis; CLD: chronic liver disease; FPG: fasting plasma glucose; HbA1c: glycated hemoglobin; HCC: hepatocellular carcinoma; HOMA-IR: homeostasis model assessment of insulin resistance; IR: insulin resistance; LC: liver cirrhosis; MAGE: mean amplitude of glycemic excursions; MASLD: metabolic dysfunction-associated steatotic liver disease; MBG: mean blood glucose; MODD: mean of daily differences; NAFLD: non-alcoholic fatty liver disease; NGT: normal glucose tolerance; OGTT: oral glucose tolerance test; SD: standard deviation; T2DM: type 2 diabetes mellitus; TIR: time in range; VIM: variability independent of the mean.
Among individuals with established MASLD or related CLD, smaller studies based on CGM suggest that GV may also be related to disease severity. Increased intraday glucose variability has been reported in patients with more advanced fibrosis on liver biopsy, suggesting that glucose instability may be accentuated in progressive fibrotic disease [14]. Furthermore, CGM studies in patients with CLD and T2DM reveal clinically relevant glucose variations, such as postprandial hyperglycemia and nocturnal hypoglycemia, which may go unnoticed if only HbA1c is analyzed, even when conventional glycemic control appears acceptable [16]. The phenotype and stage of the disease appear to modulate these relationships, as suggested by data showing less favorable glucose dynamics with increased risk of fibrosis in patients with MASLD and diabetes [13]. Extending the prognostic implications beyond fibrosis, large population data indicate that greater GV between visits independently predicts the incidence of HCC in people with diabetes, reinforcing GV as a marker of long-term liver risk [101].
Data from heterogeneous study designs suggest a reproducible association between GV and liver-related outcomes. Greater GV has been linked to the severity of steatosis, more advanced fibrosis, and unfavorable glucose profiles in CLD, while long-term variability between visits has also been associated with the incidence of NAFLD and HCC. Notably, several studies report these relationships independently of mean blood glucose and despite acceptable HbA1c levels. However, most evidence comes from observational cohorts and relatively small studies on GGV, so causality cannot be established. Taken together, current findings support GV as a potential complementary marker of metabolic stress that may identify liver risk not captured by conventional glycemic indices, but prospective longitudinal studies are still needed to determine its predictive and clinical utility.
Sociocultural and lifestyle factors, including eating habits, physical activity, sleep patterns, work schedules, and psychosocial stress, are key determinants of GV and can influence the metabolic environment in which MASLD develops and progresses.
Western-style dietary patterns, characterized by high intake of saturated fats, refined carbohydrates, fructose, and ultra-processed foods, are strongly associated with increased GV and MASLD risk. In 2023, Yang et al. [104] demonstrated that a choline-deficient, high-fat, high-sugar diet effectively induces MASH in murine models by remodelling gut microbiota composition. This dietary pattern promoted specific microbial taxa, such as Blautia producta, and increased production of metabolites such as 2-oleoylglycerol. These diet-microbiota-derived mediators activated hepatic inflammatory and fibrogenic pathways via the GPR119/TAK1/NF-κB/TGF-β1 signalling axis, leading to macrophage recruitment and HSC activation. Importantly, such dietary patterns are also associated with exaggerated postprandial glucose excursions and increased GV. These glycemic oscillations also enhance intestinal permeability and endotoxin translocation, exacerbating gut-liver axis dysfunction, which further amplifies oxidative stress and inflammatory signalling within the liver [105, 106].
Physical inactivity and sedentary lifestyles represent major sociocultural determinants of MASLD and GV, independent of body mass index (BMI). Reduced physical activity diminishes skeletal muscle glucose uptake, impairs mitochondrial biogenesis, and exacerbates systemic IR, thereby increasing circulating GV and lipid flux to the liver. Additionally, sedentary behaviour promotes lipotoxicity and mitochondrial dysfunction within hepatocytes, facilitating progression from simple steatosis to inflammatory liver injury [107].
In contrast, structured physical activity, particularly moderate-to-vigorous aerobic exercise performed for approximately 150–250 minutes per week, has been shown to reduce intrahepatic triglyceride content and improve hepatic insulin sensitivity, even in the absence of significant weight loss. Exercise also attenuates GV by enhancing peripheral glucose disposal and stabilizing postprandial glycemic responses [108].
Sleep quality and circadian rhythm are increasingly recognized as determinants of metabolic stability and hepatic health. Sleep deprivation and circadian misalignment disrupt glucose homeostasis by impairing insulin signalling, altering cortisol secretion, and promoting nocturnal hyperglycaemia and increased GV [109].
Experimental models of circadian disruption, mimicking conditions such as shift work, chronic jet lag, and sleep fragmentation, have shown exacerbation of hepatic lipid accumulation, dysregulated bile acid metabolism, and activation of inflammatory pathways [110]. Similarly, a meta-analysis involving over 260,000 participants demonstrated that short sleep duration (less than 5–6 hours per night) is associated with increased risk of MASLD, IR, and hepatic steatosis [111]. A Korean population-based study involving 5,661 individuals reported that prolonged working hours (53–83 hours per week) were associated with 23% increased odds of MASLD compared with standard working hours, independent of BMI, smoking status, alcohol consumption, and physical activity [112].
Chronic psychological stress represents an additional sociocultural factor linking GV and MASLD. Persistent activation of the hypothalamic-hypophysis-adrenal axis leads to elevated glucocorticoid levels, which promote visceral adiposity, hepatic gluconeogenesis, and IR [7]. Stress-induced neuroendocrine dysregulation increases glucose fluctuations and enhances hepatic triglyceride synthesis, thereby reinforcing the metabolic environment conducive to steatohepatitis and fibrosis [113, 114]. Over time, these stress-related metabolic perturbations may synergize with other lifestyle factors to accelerate disease progression.
Despite the growing evidence linking GV to MASLD and CLD, several important limitations must be considered when interpreting the current literature and considering the clinical relevance of GV. First, the available data are highly heterogeneous in terms of study design, populations, and methods used to assess GV. Most studies are observational and predominantly cross-sectional, which precludes causal inference and limits our ability to determine whether GV is a true determinant of liver disease progression or a subsequent marker of metabolic and liver dysfunction [14, 16, 21, 71, 103]. Second, the geographic and ethnic representation of existing studies remains limited. A significant portion of the evidence comes from East Asian populations, particularly Japan, South Korea, and China. While these studies have been instrumental in establishing biological plausibility and generating hypotheses, their findings may not be directly extrapolated to other populations with different genetic backgrounds, dietary patterns, obesity prevalence, and cardiometabolic risk profiles [13–16, 21, 71, 100, 101, 103, 115]. This is especially relevant given known ethnic differences in IR, β-cell function, body fat distribution, and MASLD phenotypes [54]. Third, limitations related to the assessment of liver disease persist. In large population cohorts, MASLD is often defined using surrogate indices or non-invasive imaging rather than histology, and detailed fibrosis staging is often unavailable. Consequently, the relationship between GV and clinically meaningful endpoints, such as fibrosis progression, cirrhosis, and liver-related events, remains insufficiently characterized. This limits our understanding of whether GV is simply associated with hepatic steatosis or whether it contributes significantly to advanced liver disease and prognosis [116, 117]. Finally, methodological limitations in measuring GV further complicate interpretation. Long-term variability between visits derived from FPG or HbA1c captures chronic glycemic instability but does not reflect short-term fluctuations, postprandial variations, and nocturnal hypoglycemia, which may be particularly relevant in patients with liver dysfunction. In contrast, CGM-based studies provide a high-resolution assessment of short-term GV, but are limited by small sample sizes, short monitoring periods, hospital settings, and restricted applicability to free-living conditions [118].
GV has become a clinically significant dimension of dysglycemia that complements traditional measures of glucose exposure in MASLD. Beyond its established association with cardiovascular risk, accumulated experimental, clinical, and population evidence indicates that glucose instability reflects underlying metabolic stress, IR, and impaired hepatic glucose management across the spectrum of MASLD. Importantly, GV captures dynamic abnormalities, particularly postprandial hyperglycemia and short-term glucose fluctuations, that are not adequately represented by FPG or HbA1c, especially in the early phase of the disease, in non-obese phenotypes, and in advanced hepatic dysfunction, where conventional glycemic markers may not be reliable.
However, despite these new insights, significant conceptual gaps remain in defining the clinical role of GV in MASLD. Current evidence does not support GV as a universal target in all patient populations. Rather, its clinical relevance appears to be context-dependent, varying according to diabetes status, obesity, stage of fibrosis, and underlying metabolic phenotype. Available data suggest that GV may function as a significant risk modifier in selected subgroups, such as individuals with early-stage MASLD, normal or near-normal HbA1c values, or advanced liver dysfunction, rather than as a generally applicable marker for all patients with MASLD [13, 16, 21, 50, 90, 91, 103].
Future research should therefore move beyond descriptive and association-based studies to identify specific populations in which GV assessment provides added value over established metabolic markers. Large, multi-ethnic prospective cohorts incorporating standardized GCM protocols, robust liver phenotyping, and clinically relevant outcomes are needed to clarify causality and prognostic significance. In parallel, interventional studies focusing on GV, rather than just mean blood glucose, will be essential to determine whether reducing glucose fluctuations can significantly modify the progression of liver disease and cardiovascular outcomes, and to define how GV can be integrated into precision-based approaches for the treatment of MASLD.
AGEs: advanced glycation end products
Akt: protein kinase B
ATP: adenosine triphosphate
BMI: body mass index
CGM: continuous glucose monitoring
ChREBP: carbohydrate-responsive element-binding protein
CLD: chronic liver disease
CV: coefficient of variation
CVD: cardiovascular disease
DAMPs: damage-associated molecular patterns
ECM: extracellular matrix
ERK: extracellular signal-regulated kinase
FFAs: free fatty acids
FGF21: fibroblast growth factor 21
FPG: fasting plasma glucose
GLUTs: glucose transporters
GV: glycemic variability
HbA1c: glycated hemoglobin
HCC: hepatocellular carcinoma
HK2: hexokinase 2
HOMA-IR: homeostasis model assessment of insulin resistance
HSCs: hepatic stellate cells
HSL: hormone-sensitive lipase
IL-6: interleukin-6
IR: insulin resistance
IRS: insulin receptor substrate
JNK: c-Jun N-terminal kinase
LECT2: leukocyte cell-derived chemotaxin 2
LPL: lipoprotein lipase
MAGE: mean amplitude of glycemic excursions
MAPK: mitogen-activated protein kinase
MASH: metabolic dysfunction-associated steatohepatitis
MASLD: metabolic dysfunction-associated steatotic liver disease
MetS: metabolic syndrome
MODD: mean of daily differences
NADPH: nicotinamide adenine dinucleotide phosphate
NAFLD: non-alcoholic fatty liver disease
NF-κB: nuclear factor kappa-B
NLRP3: NOD-like receptor protein 3
PDGF: platelet-derived growth factor
PKM2: pyruvate kinase M2
RBP4: retinol-binding protein 4
ROS: reactive oxygen species
SCFAs: short-chain fatty acids
SD: standard deviation
SHBG: sex hormone-binding globulin
SOX9: SRY-box transcription factor 9
SREBP-1c: sterol regulatory element-binding protein 1c
T2DM: type 2 diabetes mellitus
TGF-β: transforming growth factor-β
TIMPs: tissue inhibitors of metalloproteinases
TIR: time in range
TLR4: toll-like receptor 4
TNF-α: tumor necrosis factor alpha
VEGF: vascular endothelial growth factor
α-SMA: α-smooth muscle actin
FMMD: Investigation, Writing—original draft. EAJC: Investigation, Writing—original draft. MMRM: Investigation, Visualization, Writing—original draft, Writing—review & editing. SGC: Investigation, Visualization, Writing—review & editing. NMS: Conceptualization, Supervision, Writing—original draft, Writing—review & editing. All authors read and approved the submitted version.
Nahum Méndez-Sánchez, who is the Associate Editor and Guest Editor of Exploration of Digestive Diseases, was not involved in the decision-making or the review process of this manuscript. The other authors declare no conflicts of interest.
Not applicable.
Not applicable.
Not applicable.
Not applicable.
Not applicable.
© The Author(s) 2026.
Open Exploration maintains a neutral stance on jurisdictional claims in published institutional affiliations and maps. All opinions expressed in this article are the personal views of the author(s) and do not represent the stance of the editorial team or the publisher.
Copyright: © The Author(s) 2026. This is an Open Access article licensed under a Creative Commons Attribution 4.0 International License (https://creativecommons.org/licenses/by/4.0/), which permits unrestricted use, sharing, adaptation, distribution and reproduction in any medium or format, for any purpose, even commercially, as long as you give appropriate credit to the original author(s) and the source, provide a link to the Creative Commons license, and indicate if changes were made.

View: 5110
Download: 41
Times Cited: 0
