Original Article

Affiliation:
1School of Energy and Power Engineering, Jiangsu University, Zhenjiang 212013, Jiangsu, China
Affiliation:
2School of Physics, Jilin Normal University, Siping 136000, Jilin, China
Affiliation:
1School of Energy and Power Engineering, Jiangsu University, Zhenjiang 212013, Jiangsu, China
Affiliation:
1School of Energy and Power Engineering, Jiangsu University, Zhenjiang 212013, Jiangsu, China
Affiliation:
3Research Center for Bioconvergence Analysis, Korea Basic Science Institute (KBSI), Cheongju 28119, Republic of Korea
Affiliation:
1School of Energy and Power Engineering, Jiangsu University, Zhenjiang 212013, Jiangsu, China
Email: binli@ujs.edu.cn
Affiliation:
1School of Energy and Power Engineering, Jiangsu University, Zhenjiang 212013, Jiangsu, China
Email: victoryu66@ujs.edu.cn
ORCID: https://orcid.org/0000-0003-2436-5162
Explor BioMat-X. 2024;1:14–22 DOI: https://doi.org/10.37349/ebmx.2023.00003
Received: February 24, 2023 Accepted: April 18, 2023 Published: January 01, 2024
Academic Editor: Gianni Ciofani, Istituto Italiano di Tecnologia, Italy
Aim: This study aims to discover an alternative precursor with abundant source and low cost for multicolor graphene quantum dots (GQDs) preparation and application.
Methods: In the current study, anthracite-derived multicolor GQDs were prepared at different reaction temperatures (100°–150°C), referring to the GQDs 100, GQDs 120, GQDs 130, and GQDs 150.
Results: The GQDs 100, GQDs 120, GQDs 130, and GQDs 150 solutions were found to be orange-red, yellow-green, green, and blue under 365 nm excitation UV (ultraviolet) lamp, respectively. The X-ray photoelectron spectroscopy (XPS) data suggests high temperature intensifies oxidation of the amorphous sp3 carbon, resulting in GQDs with higher crystalline structure (Csp2). Compared with the GQDs 100 and GQDs 120, the GQDs 130 and GQDs 150 showed much better biocompatibility, which may attribute to their higher Csp2 composition and smaller size.
Conclusions: The results suggest that GQDs 130 and GQDs 150 are ideal candidates for nanomedicine applications, e.g., drug/gene delivery and bio-imaging, etc.
Compared with micron-sized graphene oxide (GO), nano-sized GO, especially graphene quantum dots (GQDs), exhibit superior physicochemical, optical, and photoelectric properties, e.g., biocompatibility, hydrophilicity, chemical stability, resistance to photo-bleaching and stable fluorescence (FL) emission, exhibiting great application potentials in bio-imaging, drug/gene delivery and photo-catalysis [1, 2]. So far, various carbon sources have been used to prepare GQDs, e.g., graphene, graphite, carbon nanotube, carbon fiber and active carbon, etc. [3, 4]. Nevertheless, those carbon-based precursors are relatively expensive, and hence it is imperious to discover an alternative precursor with abundant source and low cost for GQDs synthesis [4–6].
As an earth-abundant and low-cost fossil fuel, coal contains nano-sized sp2 carbon areas, separated by sp3 amorphous carbons [5]. In 2013, GQDs were first synthesized by oxidation of coal using H2SO4 and HNO3 (3:1) [4]. Using similar approaches, various blue GQDs and carbon quantum dots (CQDs) were then developed. For instance, by altering the reaction temperature (e.g., 50°–150°C) in strong acid, multicolor GQDs (from green to orange-red) were reported by Ye et al [5]. Alternatively, GQDs with adjustable colors can also be prepared via electrochemical exfoliation of coke [6]. More recently, H2O2 was used as a green oxidant to produce blue GQDs via hydrothermal treatment, where black carbon was selected as precursor [7]. Although electrochemical exfoliation and H2O2 treatment are promising approaches for the synthesis of GQDs in a greener way, it should be noted that those methods are only effective for certain kinds of coal [6, 7]. Hence, it is still a great challenge to develop a universal and effective approach for fabricating multicolor GQDs from low-cost coal. Furthermore, the size and structure effect of the GQDs (e.g., sp2 carbon or sp3 carbon dominance) on cell viability is still poorly understood. In the current study, anthracite-derived multicolor GQDs (from blue to orange-red) were prepared via acid oxidation at different temperatures. The size and structure effect of the GQDs on cell viability was highlighted, while FL imaging in vitro using those GQDs was also tested.
Anthracite (Hongda Boyu Technology Co., LTD, Beijing, China), H2SO4 (95–98%, Huafu Chemical, Yangzhou, China), and HNO3 (70%, Huafu Chemical, Yangzhou, China) were used as received unless noted otherwise. Milli-Q water with a resistivity of 18.2 MΩ∙cm was used throughout the study (Milli-Q® Direct Water Purification System).
In a typical procedure, 2 g of anthracite was dispersed in a mixed solvent of 150 mL sulfuric acid and 50 mL nitric acid. The solution was sonicated (Cole Parmer®, model 08849-00) for 2 h and then heated at different temperatures (100°–150°C) for 1 day. After the thermal oxidation, a clear brown-red solution resulted. The solution was then cooled in an ice-water bath and diluted 3× with deionized (DI) water. After that, the solution was dialyzed in a 1,000 daltons cellulose dialysis bag (Yuanye Bio-Technology Co. Ltd, Shanghai, China) against DI water for 3 days. The resulted products are named as GQDs 100, GQDs 120, GQDs 130, and GQDs 150, respectively, depending on the reaction temperature. More details about sample characterizations [e.g., transmission electron microscopy (TEM), atomic force microscope (AFM), X-ray photoelectron spectroscopy (XPS), X-ray diffraction (XRD), etc.] can be found in the Supplementary material.
The Raman and XRD spectra of anthracite were shown in Supplementary material, suggesting that anthracite contains a certain amount of sp2 carbon areas. As shown in Figure 1, anthracite powders were first oxidized in strong acid at a certain temperature for 24 h, resulting in a clear brown solution. The resulted products are named as GQDs 100, GQDs 120, GQDs 130, and GQDs 150, respectively, depending on the reaction temperature. More details about GQDs synthesis and characterizations can be found in the Supplementary material. GQDs 100, GQDs 120, GQDs 130, and GQDs 150 solutions were found to be orange-red, yellow-green, green, and blue under 365 nm excitation UV (ultraviolet) lamp (Figure 1), respectively.
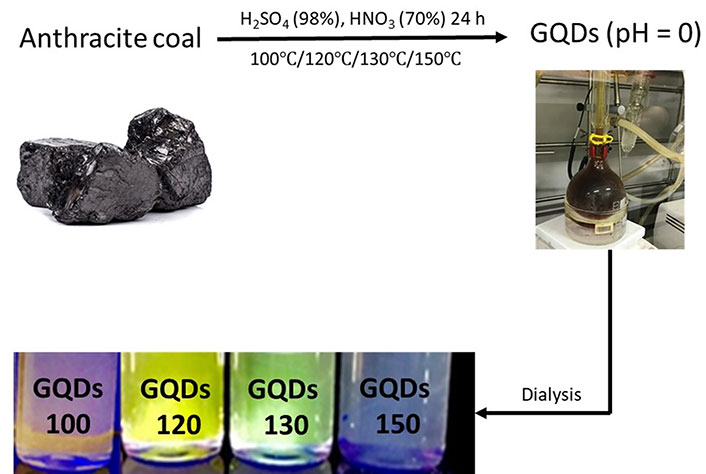
Schematic diagram of preparing multicolor GQDs (solution of GQDs under 365 nm excitation UV lamp)
Nano-structure and size distribution of the GQDs 100, GQDs 120, GQDs 130, and GQDs 150 were studied using high resolution transmission electron microscopy (HRTEM) in Figure 2. GQDs 100 were found to be a mixture of large-sized amorphous CQDs (~50 nm) and smaller sized GQDs (~5 nm). The HRTEM image of GQDs shows a clear lattice spacing of ~0.21 nm, corresponding to the (102) lattice space of graphitic carbon. A mixture of amorphous CQDs (~30 nm) and GQDs (~3 nm) were also observed for the GQDs 120. The average sizes of the GQDs 130 and GQDs 150 were measured to be ~5 nm and ~2 nm, respectively. Amorphous CQDs were not found in the GQDs 130 and GQDs 150 samples, suggesting amorphous carbon in anthracite was completely oxidized under those conditions.
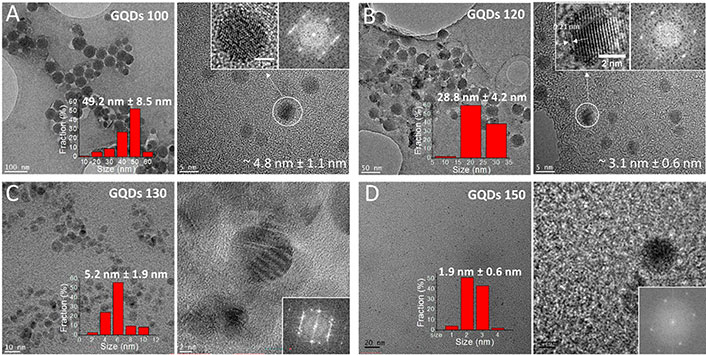
HRTEM images and size distribution of the GQDs 100, GQDs 120, GQDs 130 and GQDs 150
As shown in Supplementary material, morphologies and height profiles of GQDs 100, GQDs 120, GQDs 130 and GQDs 150 were measured by atomic force microscope (AFM). GQDs 100 and GQDs 120 contain particles with various sizes, in good agreement with the transmission electron microscopy (TEM) observation in Figure 2. Height profiles of the GQDs 100 were found to be 4–10 nm, suggesting a mixture of 4–10 layers of GO. Thickness of the GQDs 120 were in the range of 1–4 nm, indicating 1–4 layers of GO. In comparison, size of the GQDs 130 and GQDs 150 were found to be more monodispersed, correlating well with the TEM data (Figure 2). Height profiles of the GQDs 130 and GQDs 150 were found to be ~1 nm, confirming a single layer of GO.
According to Figure 3A, all GQDs exhibited a strong UV absorption between 200–230 nm due to the π-π* electron transition of C=C bonds, while a shoulder between 300–350 nm was observed possibly attributed to the n-π* transformation of C=O bonds. Maximum emission peaks were found at 550 nm, 530 nm, 500 nm, and 440 nm when the GQDs 100, GQDs 120, GQDs 130, and GQDs 150 were stimulated at 470 nm, 470 nm, 430 nm, and 340 nm, respectively (Figure 3B–F). The GQDs size dependent blue shift of the emission wavelength should partially ascribed to the quantum confinement effect, considering the size difference among the GQDs [8]. Furthermore, all GQDs underwent a red shift on the FL emission with increasing excitation wavelength, which was commonly seen for GQDs, indicating an excitation-dependent behavior [9–11].
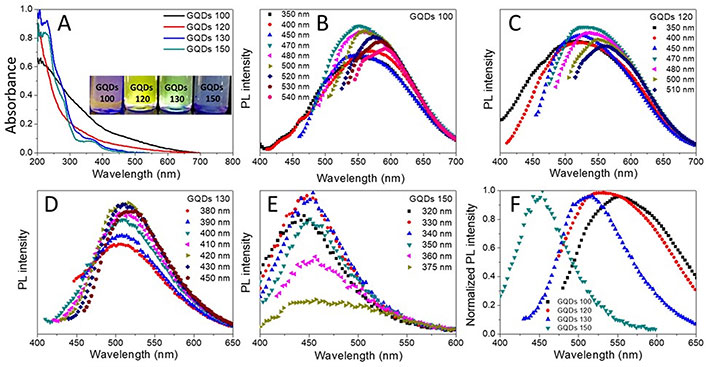
Photoluminescence (PL) of the GQDs. A. Ultraviolet-visible (UV-Vis) absorption spectra of GQDs; B–E. FL emission spectra under different excitation waves for the GQDs 100, GQDs 120, GQDs 130, and GQDs 150, respectively; F. the maximum emission of GQDs showing blue-shift
The XPS spectra (Figure 4) showed that the GQDs are primarily consisted of C and O elements, including fractions of Csp2 (284.5 eV), Csp3 (285.3 eV), C−O (287.2 eV), and COOH (289.2 eV) peaks [12]. Area fractions of the Csp2 peaks were measured to be 4.1%, 12.5%, 46.1%, and 46.9% for the GQDs 100, GQDs 120, GQDs 130, and GQDs 150, respectively. Whereas the fractions of Csp3 peaks were reduced from 53.3% to 21.1% when increasing the reaction temperature from 100°C (GQDs 100) to 150°C (GQDs 150). The XPS data suggests high temperature intensifies oxidation of the amorphous sp3 carbon, resulting in GQDs with higher crystalline structure (Csp2), in good agreement with the HRTEM data in Figure 2.
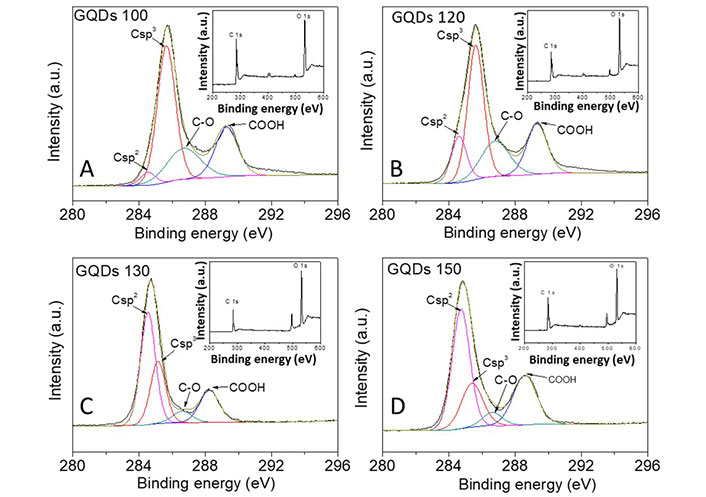
High-resolution C 1s XPS spectrum for the GQDs 100, GQDs 120, GQDs 130, and GQDs 150, respectively (XPS survey is inset). a.u.: absorbance unit
To explore the PL origin of GQDs, the time-resolved emission spectra (TRES) of the GQDs 100, GQDs 120, GQDs 130, and GQDs 150 were excited by 375 nm and executed at 555 nm, 521 nm, 503 nm, and 455 nm emission wavelengths respectively at room temperature (Figure 5).
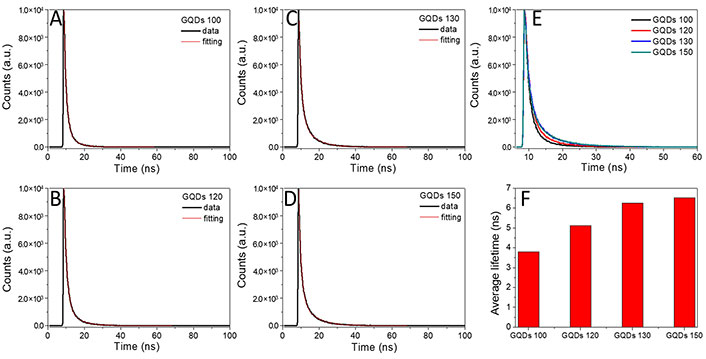
The time-resolved PL decay profiles of the GQDs 100, GQDs 120, GQDs 130 and GQDs 150
The double exponential PL decay curves of GQDs were well fitted by equation (1). where I(t) indicates intensity, τ1 and τ2 are the decay time constants, A1 and A2 refer to the weight coefficients of τ1 and τ2, respectively [13, 14]. Furthermore, the average lifetime (τavg) of the GQDs was calculated by equation (2).
Equation (1):
Equation (2):
As shown in Figure 5, the bi-exponential decay time can be subdivided into two emission states, e.g., the intrinsic state (fast decay) and the defect state (slow decay) [15, 16]. Compared with the intrinsic state, emission resulted from the defect state (e.g., oxygen-containing groups) usually displays a longer lifetime [15–18]. The fitting parameters of the GQDs FL decay are listed in Table 1. The shorter lifetime (τ1) of 1.32–1.53 ns may attribute to the intrinsic state emission, while the longer lifetime (τ2) of 4.89–7.17 ns may result from the defect state emission. τ2 increased from 4.89 ns (GQDs 100), 6.30 ns (GQDs 120) to 6.93 ns (GQDs 130) and 7.17 ns for the GQDs 150. The average lifetimes of the GQDs 100, GQDs 120, GQDs 130, and GQDs 150 were found to be 3.8 ns, 5.1 ns, 6.2 ns, and 6.5 ns, respectively, which are clearly longer than those previously reported data (< 2.5 ns) [4]. Although little variation of τ1 was found for the GQDs, distinct differences between τ2 appeared, indicating τavg of the GQDs are dominated by the defect state emission (Figure 5F) [19, 20].
Fitting parameters of the GQDs FL decay
| Sample | τ1 (ns) | A1 (%) | τ2 (ns) | A2 (%) | τavg (ns) |
|---|---|---|---|---|---|
| GQDs 100 | 1.32 | 61.81 | 4.89 | 38.19 | 3.804529 |
| GQDs 120 | 1.53 | 57.44 | 6.30 | 42.56 | 5.122501 |
| GQDs 130 | 1.48 | 40.22 | 6.93 | 59.78 | 6.245294 |
| GQDs 150 | 1.37 | 39.51 | 7.17 | 60.49 | 6.526459 |
Biocompatibility of the GQDs 100, GQDs 120, GQDs 130, and GQDs 150 were tested using MDA-MB-231 cells. As shown in Figure 6A, cell viabilities of the GQDs 100 and GQDs 120 decreased dramatically with increasing CQDs concentration, and only ~50% of the cells still lived at a GQDs concentration of 0.5 mg/mL after 24 h. In comparison, the biocompatibility of the GQDs 130 and GQDs 150 was found to be much better, compared with that of the GQDs 100 and GQDs 120. Cell viability of the GQDs 130 and GQDs 150 was approaching 95% even at a high GQDs concentration of 1 mg/mL, suggesting the GQDs are ideal candidates for nanomedicine applications, e.g., drug/gene delivery and bio-imaging, etc. The huge differences in biological compatibility of the GQDs may derive from their different size and carbon composition, e.g., the ratio between the Csp2 and Csp3. The cell viability data may suggest that amorphous carbon is more toxic than crystalline carbon (Csp2), although future work needs to be carried out to verify this idea. Furthermore, the GQDs 150 were introduced into the MDA-MB-231 cells for in vitro bioimaging, where the MDA-MB-231 cells were imaged using an LSM510 confocal laser scanning microscope (with an argon blue laser light at 488 nm and a 505 nm emission filter). As shown in Figure 6B, the GQDs 150 showed clear FL in MDA-MB-231, indicating the GQDs 150 are promising fluorescent agent. There are molecular dyes with similar properties/structures like pyrene are toxic [21], while other dyes suffer from bleaching [22]. From this perspective, the GQDs 130 and GQDs 150 are ideal candidates for nanomedicine applications (e.g., drug/gene delivery and bio-imaging, etc.), owing to their excellent biocompatibility and PL response.
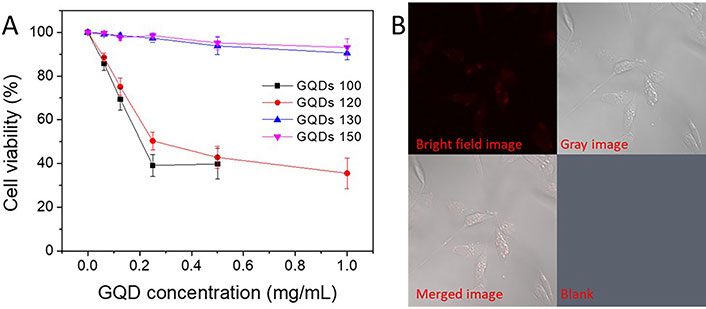
Biocompatibility of the GQDs. A. Cell viability of the GQDs 100, GQDs 120, GQDs 130, and GQDs 150 for 24 h; B. confocal FL images of GQDs 150 in MDA-MB-231 cells
In the current study, GQDs were prepared using anthracite as a precursor. The GQDs 100, GQDs 120, GQDs 130, and GQDs 150 solutions were found to be orange-red, yellow-green, green, and blue under 365 nm excitation UV lamp, respectively. The XPS data suggests high temperature intensifies oxidation of the amorphous sp3 carbon, resulting in GQDs with higher crystalline structure (Csp2). Compared with the GQDs 100 and GQDs 120, the GQDs 130 and GQDs 150 showed much higher biocompatibility, which may attribute to their higher Csp2 composition and smaller size. The results suggest the GQDs 130 and GQDs 150 are ideal candidates for nanomedicine applications, e.g., drug/gene delivery and bio-imaging, etc. Further work will focus on uncovering the mechanism between biocompatibility differences of the GQDs, whilst enhancing the PL intensity of the GQDs.
CQDs: carbon quantum dots
FL: fluorescence
GO: graphene oxide
GQDs: graphene quantum dots
HRTEM: high resolution transmission electron microscopy
PL: photoluminescence
UV: ultraviolet
XPS: X-ray photoelectron spectroscopy
The supplementary material for this article is available at: https://www.explorationpub.com/uploads/Article/file/10133_sup_1.pdf.
HP: Investigation, Writing—original draft. JC, WZ, LC, and JYY: Investigation. BL: Writing—review & editing. KY: Conceptualization, Methodology, Investigation, Writing—review & editing, Funding acquisition, Project administration.
The authors declare that they have no conflicts of interest.
Not applicable.
Not applicable.
Not applicable.
Data will be available on reasonable request.
This research was funded by the
© The Author(s) 2024.
Copyright: © The Author(s) 2024. This is an Open Access article licensed under a Creative Commons Attribution 4.0 International License (https://creativecommons.org/licenses/by/4.0/), which permits unrestricted use, sharing, adaptation, distribution and reproduction in any medium or format, for any purpose, even commercially, as long as you give appropriate credit to the original author(s) and the source, provide a link to the Creative Commons license, and indicate if changes were made.