 Original Article

Affiliation:
1Department of Orthopaedic Surgery, Sapporo Medical University School of Medicine, Sapporo 060-8543, Japan
Email: ogon.izaya@sapmed.ac.jp
ORCID: https://orcid.org/0000-0001-6949-4553
Affiliation:
2Faculty of Health Sciences, Hokkaido University, Sapporo 060-0812, Japan
ORCID: https://orcid.org/0000-0003-1077-9188
Affiliation:
1Department of Orthopaedic Surgery, Sapporo Medical University School of Medicine, Sapporo 060-8543, Japan
ORCID: https://orcid.org/0000-0001-5665-9072
Affiliation:
1Department of Orthopaedic Surgery, Sapporo Medical University School of Medicine, Sapporo 060-8543, Japan
ORCID: https://orcid.org/0000-0003-3029-5711
Affiliation:
3Department of Orthopaedic Surgery, Sapporo Maruyama Orthopaedic Hospital, Sapporo 060-0007, Japan
ORCID: https://orcid.org/0000-0003-4438-9401
Affiliation:
1Department of Orthopaedic Surgery, Sapporo Medical University School of Medicine, Sapporo 060-8543, Japan
ORCID: https://orcid.org/0000-0002-4860-9259
Explor Musculoskeletal Dis. 2023;1:54–63 DOI: https://doi.org/10.37349/emd.2023.00009
Received: January 12, 2023 Accepted: May 12, 2023 Published: June 29, 2023
Academic Editor: Fernando Pérez-Ruiz, Cruces University Hospital, Spain
Aim: It is shown that the diminished function of the psoas major is mainly associated with increased lipid content; nonetheless, whether the fat content of the psoas major is associated with intervertebral disc degeneration (IVDD) is still under study. It is hypothesized that IVDD is correlated with the lipid content of the psoas major and that IVDD can be comprehensively investigated using quantitative magnetic resonance imaging (MRI). Consequently, this study aimed to analyse the association between the psoas major extramyocellular lipid (EMCL) and intramyocellular lipid (IMCL) content and disc degeneration quantified using MRI T2 mapping in patients with chronic low back pain (CLBP).
Methods: In this study, 20 men and 23 women (mean age, 63.1 years ± 2.6 years) underwent magnetic resonance spectroscopy (MRS). The psoas major IMCL and EMCL content of patients was analysed. T2 values of the anterior annulus fibrosus (AF), nucleus pulposus (NP), and posterior AF were evaluated using MRI T2 mapping. Multiple linear regression analysis was used to determine the possible correlations of the psoas major EMCL and IMCL content with the T2 values of the anterior AF, NP, and posterior AF.
Results: The EMCL content and T2 values of the anterior AF were significantly and negatively correlated [standardised partial regression coefficient (β) = −0.60, P < 0.01]. There were no significant correlations between the EMCL content and T2 values of the NP (β = −0.16, P = 0.30) or posterior AF (β = −0.14, P = 0.49) or between the IMCL content and T2 values of the anterior AF (β = −0.04, P = 0.82), NP (β = 0.05, P = 0.73), or posterior AF (β = −0.11, P = 0.58).
Conclusions: The EMCL content and T2 values of the anterior AF were correlated. Conversely, the IMCL content and T2 values were not correlated.
Low back pain (LBP) is a serious chronic condition with a global prevalence [1, 2], and it is estimated that approximately 23.0% of patients with LBP will develop chronic LBP (CLBP) [3]. In LBP, the trunk muscles are significantly involved as they extend the vertebrae for an erect posture [4]. Moreover, among the paraspinal muscles, the psoas major has the most significant function in maintaining posture. Another major contributing factor to CLBP is intervertebral disc degeneration (IVDD) [5]. Spinal stability and disc stress absorption are greatly compromised by IVDD, a multifactorial, chronic condition that cannot be reversed [6]. Proteoglycan and water losses are early biochemical alterations in IVDD, whereas nucleus pulposus (NP) herniation, annular tears, and reduced disc height are late morphological changes [7]. During the progression of disc degeneration, there may be a link between abnormalities in the vertebral endplate and decreasing muscular mass of the trunk muscles [8–13]. CLPB induces muscle remodelling, such as muscle atrophy, fatty infiltration, and fibre type alternation [8–13]. When the nearby spinal endplates are injured, fatty infiltration in the trunk muscles at the L4/L5 level is worsened [13]. Thus, the formation of IVDD is not an isolated process but a chain reaction that includes vertebral endplate changes and fatty infiltration in the trunk muscles [14]. Muscle degeneration associated with ageing is characterised by muscle atrophy and fatty infiltration, which can be evaluated using ultrasonography [15], computed tomography [16], and magnetic resonance imaging (MRI) [17]. Moreover, MRI is used to assess muscle fat degeneration. For composition or chemical assessments of the muscles, MRI with the multipoint Dixon technique [18] and magnetic resonance spectroscopy (MRS) [19] have recently been used. MRS analysis of muscle physiology has facilitated the detailed analysis of muscular fat masses by identifying intramyocellular lipids (IMCLs) and extramyocellular lipids (EMCLs). Fatty tissue degeneration is better characterised using MRS than with the previous evaluation methods [20, 21]. EMCL exists as subcutaneous extracellular fat in cells between muscle fibres [20, 22, 23]. In contrast, IMCL is undetectable using conventional MRI because it appears as lipid droplets in skeletal muscle cells in close contact with the skeletal mitochondria [21, 24].
MRI T2 mapping is based on T2 values used for quantifying the moisture content and collagen sequence breakdown of the intervertebral disc (IVD). MRI T2 mapping has previously been used to quantify the extent of IVDD [25]. A trend has been demonstrated that T2 values decrease as the Pfirrmann classification grade increases [26]. However, conventional MRI cannot fully visualise the annulus fibrosus (AF), whereas AF degeneration can be quantitatively evaluated using MRI T2 mapping.
The diminished function of the psoas major is mainly associated with increased fat content; however, whether the fat content of psoas is related to the degree of disc degeneration remains unknown [27]. It is hypothesized that IVDD is correlated with the lipid content of the psoas major and that IVDD can be comprehensively investigated using quantitative MRI. Therefore, this study aimed to analyse the potential association of the EMCL and IMCL content of the psoas major with IVDD, using quantitative MRI T2 mapping, in patients with CLBP.
This study included patients aged 41−79 years diagnosed with non-specific CLBP, which manifests as pain, stiffness, and lower-back discomfort with unidentifiable aetiology, and whose symptoms persisted, despite treatment with medications or exercise therapy for more than 3 months. Patients with neoplasms, infections, fractures, or a history of lumbar vertebral surgery were excluded. As an indicator of obesity, the body mass index (BMI) was calculated using the self-reported body weight (kg) of patients divided by their height squared (m2). Triglyceride (TG), total cholesterol (T-chol), high-density lipoprotein (HDL), and low-density lipoprotein (LDL) levels were assessed in blood samples. Following a prior report [28], data on physical workload and exercise intensity level were gathered. There were four options depending on the vocational activities that may be selected to gauge the physical workload: sedentary work or resignation; light physical work, including official work, teaching, and salesclerk, where they moved around a lot and carried light loads; moderately heavy work, including plumbing, woodworking, and healthcare, where they moved around a lot and carried heavy loads; and heavy work, including husbandry, building operation, fishery, and forestry, where they moved around a lot and carried a lot of heavy loads and dealt with a lot of physical burdens. There were five different options available to choose from when determining the level of physical activity: almost nothing; occasionally a saunter; light physical activity, such as walking, biking, dancing, and fishing for at least 2 h per week; moderate physical activity, such as gymnastics, swimming, tennis, soccer, and running for 2 h per week; and high physical activity, such as gymnastics, swimming, tennis, soccer, and running for more than 2 h per week.
A previously described MRI protocol was used [26, 29–33]. Sagittal and transverse T2-weighted MRI were obtained using the Signa HDx 1.5T-MRI system with a spine coil from GE Healthcare in Milwaukee, Wisconsin, in USA. These pictures were used to locate the proton MRS volume of interest (VOI) at the right L4/L5 level, near the middle of the psoas major (Figure 1). With the following settings, single-voxel point-resolved sequence spectroscopy was performed: the VOI size was 15 mm × 15 mm × 15 mm (3.4 mL), the repetition time (TR) was 2,000 ms, the echo time (TE) was 35 ms, the average number of signals was 64, and the acquisition time was 164 s. The MRS data, both with and without water suppression, were analysed, as previously described [26, 29–33]. The IMCL and EMCL content was measured using the spectral data obtained with LCModel software (Stephen Provencher, Inc., Oakville, ON, Canada). Data were transferred from the scanners to a Linux workstation, and metabolites were quantified using eddy-current correction and water scaling. The final spectra are those with water suppression. The IMCL (1.3 ppm) and EMCL (1.5 ppm) data, corresponding to the methylene protons, were statistically analysed. The measurements of the IMCL and EMCL were automatically scaled to an unsuppressed water peak (4.7 ppm) and the total creatine (Cr) peak (approximately 3.03 ppm) to calculate the lipid concentration (Conc.) in mmol/L. In this study, the TR and TE were fixed, and the institutional units were deleted because they were not considered. Consequently, the simulated lipids and macromolecules did not use the lineshape function. They modified their lineshape using a rudimentary Gaussian-Lorentzian model. These data are displayed graphically with a chemical shift along the x-axis for identifying the metabolites, whereas the peak intensities are plotted on the y-axis (Figure 2).
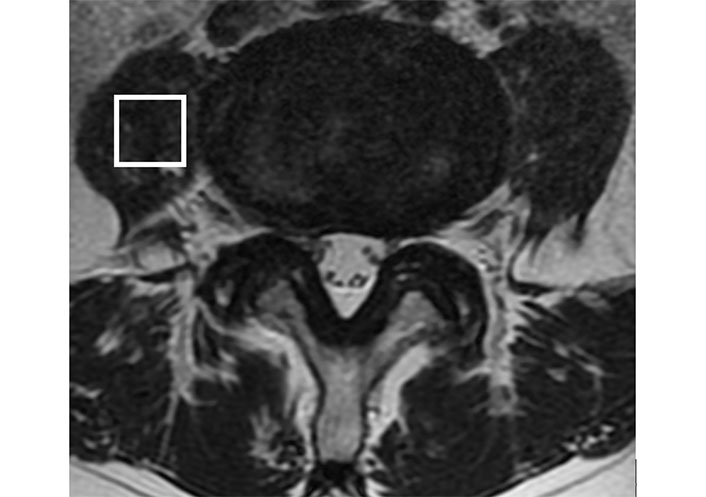
The diagram illustrates the positioning of VOI in the MRI. The VOI is positioned at the centre of the right psoas major at the L4/L5 level
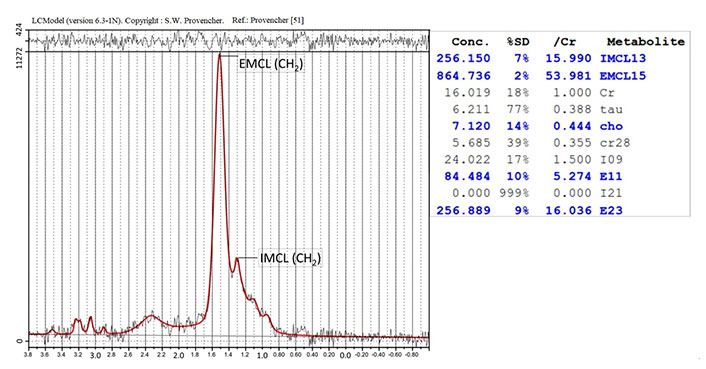
Analysis of the proton MRS of the psoas major. The identified metabolites are EMCL (CH2) and IMCL (CH2) methylene protons at 1.5 ppm and 1.3 ppm, respectively. SD: standard deviation; tau: taurine; cho: cholines; ref.: reference
We followed MRI and MRI T2 mapping analysis protocols that had previously been published [24, 33, 34]. These protocols called for the creation of a T2 map at the L4/L5 level using the T2 values in the midsagittal section from the sagittal sections centred on the lumbar midline region with optimized eight-echo multispin echo [TR, 1,000 ms; first TE, 14.8 ms; and last TE, 118 ms (Functool; GE Healthcare, Milwaukee, WI, USA)]. To lessen the impact of the stimulated echo, we did not include the initial echo in the multispin system. The signal intensity in each TE was used to create a T2 map for each pixel using the formula signal intensity (TE) = e^(–TE/T2).
According to other reports [5, 24, 28, 34–40], the disc was split into five equal regions for the measurements, with the front fifth of the anterior AF, the middle fifth of the NP, and the back fifth of the posterior AF. Measurements were made of the average values in the targeted areas (Figure 3). MedCalc 10.2.0.0 was used to measure the T2 values (MedCalc Software, Mariakerke, Belgium).
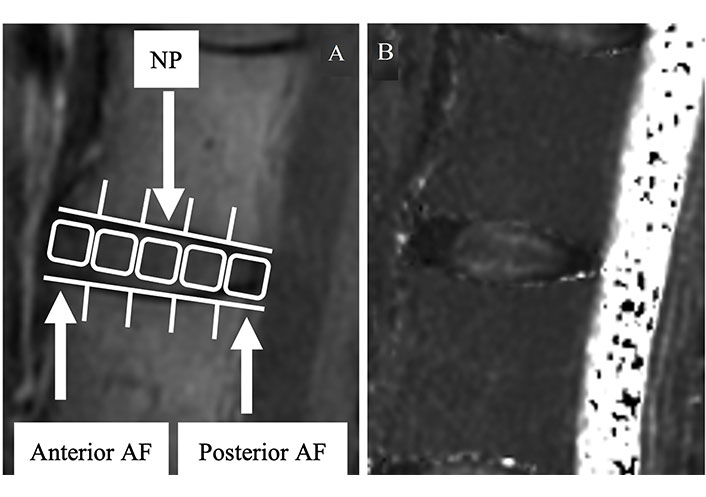
The region of interest of the disc. (A) In the second echo image, the disc is divided into five areas, designating the front of the anterior AF, mid-NP, and last fifth of the posterior AF; (B) the mean values are measured in the same regions
We analysed the associations of the EMCL and IMCL content of the psoas major with the T2 values of the anterior AF, NP, and posterior AF using multiple linear regression analysis to exclude the influence of age, sex, and BMI. Statistical significance was set at P < 0.05. All numerical data are expressed as the mean ± standard error of the mean (SEM).
Forty-three patients (20 men and 23 women; mean age, 63.1 years ± 2.6 years; age range, 41–79 years) met the diagnostic criteria for CLBP. Demographic and epidemiologic data are shown in Table 1.
Demographic and epidemiologic data
| Index | Data |
|---|---|
| Sex (male:female) | 20:23 |
| Age* (years) | 63.1 ± 2.6 |
| BMI* (kg/m2) | 23.7 ± 0.7 |
| Abdominal circumference* (cm) | 83.6 ± 2.7 |
| TG* (mg/dL) | 141.8 ± 5.9 |
| T-chol* (mg/dL) | 184.9 ± 8.5 |
| HDL* (mg/dL) | 57.1 ± 2.2 |
| LDL* (mg/dL) | 114.5 ± 4.4 |
| Physical workload | |
| Retired/sedentary work | 29 |
| Light physical work | 13 |
| Moderate heavy work | 1 |
| Heavy work | 0 |
| Leisure time physical activity level | |
| Next to nothing | 27 |
| Sometimes a walk | 14 |
| Light physical activity | 2 |
| Moderate physical activity | 0 |
| High physical activity | 0 |
*: data are expressed as the mean ± SEM
The mean BMI was 23.7 kg/m2 ± 0.7 kg/m2, and the mean abdominal circumference was 83.6 cm ± 2.7 cm. The following results were obtained for the laboratory test: TG level, 141.8 mg/dL ± 5.9 mg/dL; T-chol level, 184.9 mg/dL ± 8.5 mg/dL; HDL level, 57.1 mg/dL ± 2.2 mg/dL; and LDL level, 114.5 mg/dL ± 4.4 mg/dL. Overall, 40 patients underwent drug therapy; 28 were treated with non-steroidal anti-inflammatory drugs, 18 with acetaminophen, 13 with tramadol, and 4 with duloxetine. At the L4 and L5 levels, the following results were obtained for Pfirrmann classification grade [24]: I, 0; II, 0; III, 18; IV, 20; and V, 5. The mean T2 values of the IVD were 64.5 ms ± 2.4 ms, 71.5 ms ± 2.2 ms, and 56.3 ms ± 2.0 ms for the anterior AF, NP, and posterior AF, respectively. The mean EMCL and IMCL content of the psoas major was 1.25 × 10³ mmol/L ± 0.28 × 10³ mmol/L and 2.23 × 10² mmol/L ± 0.51 × 10² mmol/L, respectively. The results of the multiple linear regression analysis with age and sex adjustments are displayed in Table 2. EMCL and T2 values of the anterior AF had a significantly negative correlation (β = 0.60, P < 0.01). The EMCL and T2 values of the NP (β = 0.16, P = 0.30) and posterior AF (β = 0.14, P = 0.49) did not significantly correlate. Furthermore, no significant correlation was observed between the IMCL and T2 values of the anterior AF, NP, or posterior AF (β = 0.04, P = 0.82, 0.05, and 0.73, respectively).
Multiple linear regression analysis adjusted for age, sex, and BMI
| Dependent variable | Independent variable | Regression coefficient | Standard error (SE) | Standardised partial regression coefficient | P |
|---|---|---|---|---|---|
| EMCLs (mmol/L) | Anterior AF (ms) | −38.31 | 7.02 | −0.60 | < 0.01 |
| NP (ms) | −20.31 | 19.32 | −0.16 | 0.30 | |
| Posterior AF (ms) | −15.42 | 24.35 | −0.14 | 0.49 | |
| IMCLs (mmol/L) | Anterior AF (ms) | −10.6 | 34.20 | −0.04 | 0.82 |
| NP (ms) | 11.10 | 20.35 | 0.05 | 0.73 | |
| Posterior AF (ms) | −6.13 | 7.93 | −0.11 | 0.58 |
The paraspinal muscles and IVD are crucial for the functioning of the lumbar spinal column, and degeneration in either impairs their functions [40, 41]. A few MRI studies have examined the association between paraspinal muscle fatty degeneration and IVDD and demonstrated an association between IVDD and multifidus muscle degeneration based on morphological measurements (using the cross-sectional area and fat infiltration) [40, 41]. A correlation between the IMCL content of the multifidus muscle and T2 values of anterior AF has been demonstrated using quantitative MRI evaluation methods [32].
There are many indicators for evaluating muscle degeneration, such as muscle atrophy [11], muscle strength [42], muscle endurance [43], type and proportion of muscle fibres [44], and the degree of muscle fatty infiltration [45]. We used the quantitative MRI evaluation methods and chose fatty filtration. In this study, quantitative MRI evaluation methods (i.e., MRS and T2 mapping) were used, and we demonstrated a correlation between the EMCL content of the psoas major and T2 values of the anterior AF. This result suggests a possible relationship between psoas major degeneration and higher mechanical stress-loading at the anterior IVD, leading to anterior AF pressure. Few studies have discussed the association between psoas major degeneration and IVDD [46, 47]. According to animal research, there are considerable disc degeneration differences in the psoas major [46]. The fat signal percentage of paraspinal muscles is independently correlated with sex, age, and the severity of disc degeneration [47]. The degree of disc degeneration has no effect on the amount of fat infiltration in the psoas major, and the only factors that affect it are sex and age [47]. The psoas major becomes more active in female patients with pain to stabilize the lumbar spine because of considerable fat infiltration in the multifidus as a compensatory mechanism, according to a study that combats gender prejudice [48]. To the best of our knowledge, this study is the first to present a quantitative MRI evaluation of psoas major degeneration and IVDD.
We speculated on the two mechanisms of association between the EMCL content of psoas major and anterior AF degeneration as follows: 1) transformation of mechanical stress, and 2) pro-inflammatory cytokines released by adipose tissue. The first speculation was that EMCL was essentially a metabolically inactive lipid deposit associated with reduced functionality [19, 21, 22] and that EMCL was formed in inactive contractile muscles. Therefore, it was possible that the mechanical stress on the disc may have changed and IVDD occurred. The second speculation was the relevance of pro-inflammatory cytokines, which adipose tissue released for IVDD and osteoarthritis [49, 50]. James et al. [50] reported that nitric oxide synthase-2 and lipocalin expression was elevated in epidural fat, and high leptin and low arginase 1 expressions were discovered in intramuscular and subcutaneous adipose tissues. They demonstrated the potential that disc disease is associated with a local inflammatory disorder. EMCL exists as subcutaneous extracellular fat in cells between muscle fibres [20, 22, 23] and might reflect pro-inflammatory cytokines. Additionally, the psoas major was closest to the anterior AF anatomically, and pro-inflammatory cytokines could be easy to reach. Based on these perspectives, we considered the EMCL content of the psoas major to be related to anterior AF degeneration. However, we cannot explain the causality in this study owing to the cross-sectional nature of our study, and it is a limitation of this study. A longitudinal analysis would better clarify these causal relationships.
In conclusion, the findings of this cross-sectional study revealed that the EMCL content was correlated with the T2 values of the anterior AF and that no correlations exist between the IMCL content of the psoas major and T2 values.
AF: annulus fibrosus
CLBP: chronic low back pain
EMCLs: extramyocellular lipids
IMCLs: intramyocellular lipids
IVD: intervertebral disc
IVDD: intervertebral disc degeneration
MRI: magnetic resonance imaging
MRS: magnetic resonance spectroscopy
NP: nucleus pulposus
TE: echo time
TR: repetition time
VOI: volume of interest
We thank Editage (https://www.editage.com/) for English language editing.
IO: Investigation, Writing—original draft. HT: Validation. TM: Project administration. MY: Software. TT: Data curation. AT: Supervision.
The authors declare that they have no conflicts of interest.
The study was conducted in accordance with the Declaration of Helsinki after approval by the Ethics Committee of Sapporo Medical University (approval number: 262-1074).
Informed consent to participate in the study was obtained from all participants.
Not applicable.
The datasets generated and/or analysed during the current study are not publicly available because of the limitations of ethical approval involving the patients’ data and anonymity; however, the datasets are available from the corresponding author (ogon.izaya@sapmed.ac.jp) on reasonable request.
Not applicable.
© The Author(s) 2023.
Copyright: © The Author(s) 2023. This is an Open Access article licensed under a Creative Commons Attribution 4.0 International License (https://creativecommons.org/licenses/by/4.0/), which permits unrestricted use, sharing, adaptation, distribution and reproduction in any medium or format, for any purpose, even commercially, as long as you give appropriate credit to the original author(s) and the source, provide a link to the Creative Commons license, and indicate if changes were made.

View: 3227
Download: 16
Times Cited: 0
