Original Article

Affiliation:
1Department of Information Science, University of North Texas, Denton, TX 76207, USA
Email: AshrafeAlam@my.unt.edu
ORCID: https://orcid.org/0009-0009-5182-5006
Affiliation:
2Department of Information Technology and Decision Science, G. Brint Ryan College of Business, University of North Texas, Denton, TX 76201, USA
ORCID: https://orcid.org/0000-0003-3810-9039
Explor Digit Health Technol. 2024;2:30–45 DOI: https://doi.org/10.37349/edht.2024.00009
Received: September 20, 2023 Accepted: November 28, 2023 Published: February 28, 2024
Academic Editor: Atanas G. Atanasov, Medical University of Vienna, Austria; Shariful Islam, Deakin University, Australia
The article belongs to the special issue Data-informed Decision Making in Healthcare
Aim: This study investigates the potential of artificial intelligence (AI) in revolutionizing healthcare insurance claim processing in the USA. It aims to determine the most effective machine learning (ML) model for predicting health insurance claims, leading to cost savings for insurance companies.
Methods: Six ML algorithms were used to predict health insurance claims, and their performance was evaluated using various metrics. The algorithms examined include support vector machine (SVM), decision tree (DT), random forest (RF), linear regression (LR), extreme gradient boosting (XGBoost), and k-nearest neighbors (KNN). The research involves a performance assessment that encompasses key metrics. Additionally, a feature importance analysis is conducted to illuminate the critical variables that exert influence on the prediction of insurance claims.
Results: The findings demonstrate that the XGBoost and RF models outperformed the other algorithms, displaying the highest R-squared values of 79% and 77% and the lowest prediction errors. The feature importance analysis underscores the pivotal role of variables such as smoking habits, body mass index (BMI), and blood pressure levels in the domain of insurance claim prediction. These results emphasize the degree to which these variables should be included in the formulation of insurance policies and pricing strategies.
Conclusions: This study supports the transformative potential of AI, with specific emphasis on the XGBoost model, in extending the precision and efficiency of healthcare insurance claim processing. The identification of key variables and the mitigation of prediction errors not only signal the potential for substantial cost savings but also affirm the potential to integrate AI into healthcare insurance processes. This research supports the value of the utilization of AI as an emerging tool for process optimization and data-informed decision-making within the healthcare insurance domain.
A sizeable amount of healthcare spending is allocated to processing insurance claims, making the healthcare sector in the USA one of the world’s largest and most complex enterprises. National health expenditure (NHE) grew 4.6% to $3.6 trillion in 2018, accounting for 17.7% of the gross domestic product (GDP) [1]. Medicare spending grew 6.4% to $750.2 billion, Medicaid expenditure grew 3.0% to $597.4 billion, private health insurance spending grew 5.8% to $1.243 trillion, and out-of-pocket spending grew 2.8% to $375.6 billion (these are 21%, 16%, 34%, and 10% of total NHE) in 2018 [1]. According to the 2021 national health statistics report, 28.1 million individuals, or 8.6% of the total population of the USA, lack health insurance coverage, 65.4% have private health insurance, 56.9% are employer-based, and 7.2% have directly purchased coverage for the population under age 65 [2]. Among this age group, nearly two of every five children and one of every five adults relied on public health coverage through Medicaid and children’s health insurance programs. These estimates are characterized based on specific sociodemographic attributes, such as age, gender, race, Hispanic origin, family income, education, employment situation, and marital status [2]. A study explored that healthcare access is a fundamental right for every American citizen [3]. Unfortunately, the USA is confronted with a substantial and expanding segment of its population lacking insurance coverage. After hitting a low point of 28.7 million individuals in 2016, the projected trajectory indicates a rise in the number of uninsured individuals to 37.2 million by 2028 [3]. This concerning trend coincides with a period in which an increasing wealth of research establishes a strong connection between having insurance coverage and notable enhancements in financial stability, overall well-being, and lifespan [3].
Health insurance claims processing is crucial in this rapidly changing environment, as it holds the potential to revolutionize the healthcare landscape by providing prompt and accurate reimbursements and optimizing insurance provider cost management and risk assessment. The processing of health insurance claims entails looking over and verifying medical records, billing data, and payment authorization. The insurance market in the USA provides a vital safety net for both individuals and corporations. Insurance companies employ data and predictive modeling to measure risk and establish premiums. However, the insurance sector’s adoption of responsible artificial intelligence (AI) ensures that forecasting models are impartial, fair, and open. In the insurance sector, predicting insurance claims is essential because it aids insurers in calculating the likelihood of an event occurring and the potential cost. The employment of AI in this process has prompted questions about bias and discrimination, particularly against specific demographic groups. Developing and deploying prediction models can be guided by responsible AI principles to alleviate all the concerns. This includes ensuring the model is transparent, understandable, constantly monitored, and updated to prevent bias and discrimination.
This study explores how the potential application of responsible AI affects claims processing accuracy and identifies the most useful model for forecasting a customer’s insurance claim process. Various methods have been explored to address concerns about AI algorithm interpretability [4]. Recent studies have created metrics for the relevance of specific covariates based on their contribution to model prediction accuracy [4]. Furthermore, it investigates the variables that can be investigated to forecast insurance claims with greater precision and address any potential ethical issues by using predictive models for processing insurance claims. To prevent prejudice and ensure that clients receive the coverage they require, it is crucial to ensure that AI systems used in insurance are developed and implemented transparently, equitably, and ethically.
The use of AI in the insurance sector has raised moral questions regarding transparency, fairness, and bias, particularly in the prediction of insurance claims. Consequently, there is an increasing focus on employing responsible AI within this sector. Ensuring the responsible development and implementation of AI systems involves transparent and ethical consideration of their potential impacts on individuals and society. This policy must be followed to protect consumers from unfair treatment and prevent discrimination against specific categories of individuals. In the insurance sector, predicting insurance claims is essential because it aids insurers in calculating the likelihood of an event occurring and the potential cost. The use of AI in this process has prompted questions about bias and discrimination, particularly against specific demographic groups. Responsible AI principles can direct the creation and use of prediction models to allay all worries. The data used to train the model must also be varied and representative of the community.
A crucial area of concentration for the insurance business is the use of responsible AI in the forecasting of insurance claims in the USA. Moreover, the use of responsible AI for forecasting insurance claims can add to the body of knowledge regarding AI ethics and governance. AI technologies must be used responsibly, ethically, and within legal and regulatory frameworks as they become more common and significant. This study seeks to answer the following questions:
What model can be used to predict an efficient insurance claim process for a customer?
Which variable could be analyzed to anticipate insurance claims more accurately?
What potential ethical considerations are associated with using such predictive models?
To identify best practices and prospective areas for development, this study also analyzes the existing literature on AI and insurance claim processing. In recent years, several businesses have started using AI to automate jobs that people are typically hired to complete, such as detecting fraudulent movements, choosing resumes, processing credit-related requests, and releasing those people for high-level duties [5]. According to a survey of 2,360 business executives about the use of AI, more than 62% of executives said that AI solutions increased their revenues, decreased their costs, and enhanced customer satisfaction [6]. AI has proven its value in different business sectors by quickly establishing automated environments that are controlled and digitally upgraded for maximum efficiency in 2017 [7]. The use of AI in Tanzania’s healthcare sector includes applications for disease prediction and diagnosis, vaccine stock optimization, and health supply chain management [8]. AI can assist in the methods mentioned above to improve customer satisfaction and revenues and cut down on fraud, inefficient time use, and operational complexity [9]. One of the important areas across Europe where AI can address many issues with the health system is the health sector [10]. Several problems prevent medical AI from being used properly and effectively. These confrontations include data privacy, intellectual property rights, accountability, openness, cybersecurity, accuracy, performance, bias, and discrimination. Thus, it is advised that strategic decisions should be made when putting AI-based innovations into practice for companies to make sure that i) they are responsible, ii) the challenges are properly addressed, and iii) there is a balance between opposing interests and values [10, 11]. Besides the hazards, the growing application of AI exacerbates intrinsic problems with trust and accountability. Enterprises must be aware of the difficulties and dangers associated with AI and take these into full consideration when presenting suggested plans to effectively address these issues [11].
Adaptive boosting (AdaBoost), a whitebox algorithm, outperforms all additional models in terms of performance, aids in lowering operating costs for providers, improves the speed and accuracy of the insurance claim process and allows patients to concentrate on their recovery rather than navigating the insurance claim appeals process [12]. Because of the unstable nature of intelligent applications, the theoretical paradigm for the growth of responsible AI was founded on perceived risk theory. Digital healthcare AI risks are inversely correlated with responsible AI [13]. There should be a complete framework for responsible AI that businesses can use to emphasize and address important issues when developing and implementing responsible AI applications. Governance provides an ongoing foundation for all other aspects and assists businesses in creating AI that complies with the relevant regulations and upholds ethical standards [14]. The operation of the Apriori algorithm consists of two steps: First, obtain frequent item sets of the largest possible size, and then, use these frequent item sets to generate rules by locating all their subsets [14]. Both supervised and unsupervised machine learning (ML) algorithms were used, including support vector machine (SVM), logistic regression, naive Bayes, random forest (RF) classifiers, deep neural networks, and AdaBoost. They examined the efficacy of every algorithm for detecting blockchain fraud and discovered that RF, AdaBoost, and SVM generated effective outcomes [15].
The aftereffects of the different processes reduced the number of claims filed as a text message was sent to the insured individual that full or a portion of a claim may be denied. Furthermore, it might impose conditions on the claimant as the decision is being made, which could prolong the process [16]. The paper’s primary goal is to use the Apriori algorithm to find similarities between medical bills and purchasing bills. This method searches a database of frequently occurring item sets to identify item sets whose occurrences exceed a specified threshold [17]. The main objective while building an AI solution is to identify the easiest model that performs the best. Using ML to solve problems in trading and investment management has made things more useful and opened new options for the economy. This is possible because computers are getting faster, data storage costs are going down, and big data is ready to use [18, 19]. A supervised learning rule first completes a foundational task using sample data and then attempts to build a temporary performance, leading to the plotting of new input vectors. In several application areas, supervised learning algorithms are used. A comparable goal is for the supervised learning rule to cut back superbly from the knowledge to the contained objects in the best possible setting, helping the rule to appropriately index the class labels for near occurrences [20–22]. It is necessary to continuously test various AI algorithms because the performance of an AI model varies with the core data structures. AI systems’ accuracy, simplicity, and inter-portability can all be traded off. To choose the finest-performing AI algorithm with the least amount of complexity and the greatest degree of interpretability, it is crucial to investigate several AI algorithms. The intended study uses six AI algorithms: two interpretable, two whiteboxes, and two blackboxes [23].
Necessary data were gathered to construct ML models based on USA health insurance claims by people aged 18 to 60 in four different regions [24]. The data covers information about insurance claims, including age, gender, body mass index (BMI), blood pressure, diabetic status, number of children, smoking status, and region of the insured person. It must be cleaned up and sorted before the data is used to build ML models. Data cleaning eliminates erroneous data by extracting input and output features that contribute to effectively fitting the best model. A description of the features is given in Table 1. Data preparation is the vital process of refining and adapting data to make it well-suited for ML algorithms. The quality of this process significantly influences the model’s performance. It encompasses tasks such as data cleansing, exploratory data analysis (EDA), standardization, and reducing dimensionality. Data cleaning is the key step of the following retrieval, which involves identifying and eliminating erroneous, misleading, incomplete, and corrupt data. By using a mean substitution, a dummy value that treats the missing feature values as missing values can take their place.
Description of health insurance database
| Number | Variable name | Explanation |
|---|---|---|
| 1. | Age | Age of primary beneficiary |
| 2. | Gender | Gender of the beneficiary |
| 3. | BMI | BMI of the beneficiary (kg/m2) using the ratio of height to weight, ideally 18.5 kg/m2 to 25 kg/m2 |
| 4. | Blood pressure | Whether the insured person has blood pressure (mmHg) or not |
| 5. | Diabetic | Whether the insured person is diabetic or not |
| 6. | Children | Number of children of the insured person |
| 7. | Smoker | Whether the insured person is a smoker or not |
| 8. | Region | The residential areas of the beneficiary in the USA are Northeast USA, Southeast USA, Southwest USA, and Northwest USA |
| 9. | Claim | Amount of the insurance claim |
EDA is applied to understand the data before applying the ML model. Data visualization with graphs reveals concealed connections between features that cannot be detected by simply viewing the dataset.
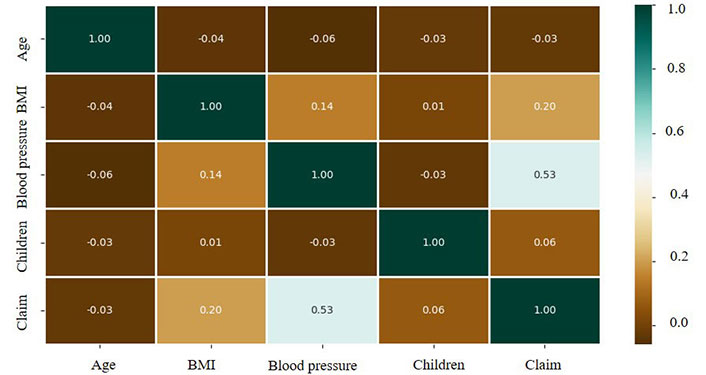
The study used a heatmap to visualize the correlation between the pair of variables and to understand the significance of all the explanatory variables concerning the response variable in Figure 1. The heatmap shows a strong relationship between blood pressure and insurance claims, followed by BMI, which has an impact on insurance claims.
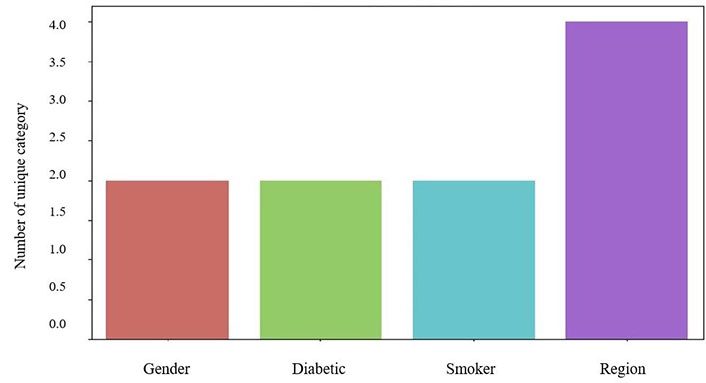
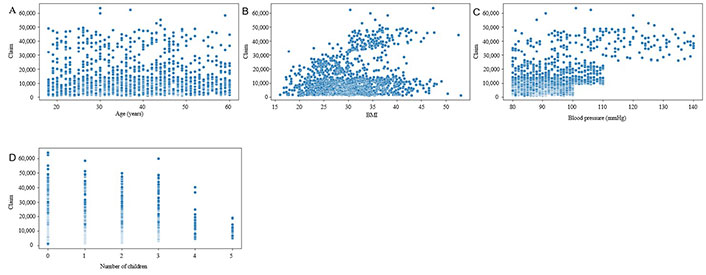
Different graphs are also displayed in Figures 2 and 3 to observe unique values of the categorical variables and the distribution of explanatory variables respectively. The age distribution is even, with a slight increase among 20–30-year-olds. BMI is normally distributed, with a peak around 30–35. Blood pressure readings are right skewed, mostly between 80–100 mmHg (1 mmHg = 0.13332 kPa) (Figure 3). The number of children per individual decreases as the number increases, with most having 0–2 children. Claim amounts are right-skewed, with most of the claims below $10,000, indicating a dataset that likely represents a demographic of young to middle-aged adults with a range of health-related characteristics and insurance claim amounts.
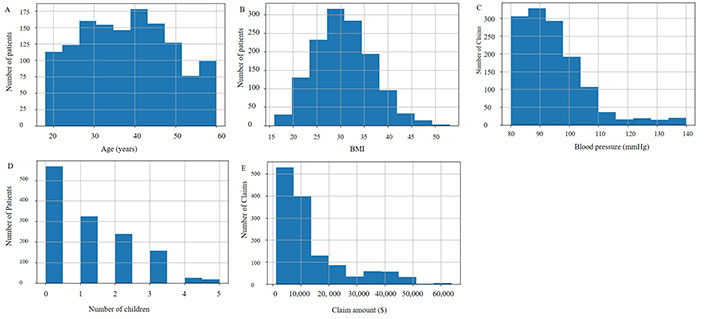
Frequency distribution of the numerical variables. A. Histogram of age; B. histogram of BMI; C. histogram of blood pressure; D. histogram of children; E. histogram of claim
Then, one-hot encoding involves transforming categorical data into a format that can contribute to ML algorithms to increase prediction accuracy. ML commonly uses one-hot encoding to handle categorical input. This gives the idea of transforming all categorical values into numerical values. Categorical data can be more expressively represented by one-hot encoding. The need for it arises from the fact that many ML algorithms fail to operate and produce the desired results when given categorical input. Data is divided into portions for training and testing, with 80% of the data being used for training and 20% of the data for testing. The dataset contains 1,065 rows and 14 columns for training and the dataset contains 267 rows and 14 columns for testing.
After the data preparation is done, the next step involves transitioning into model building. Here, the target variable has discrete values, and different regression models are used for future claim prediction. Therefore, the study used different performance measures for all models, using parametric and non-parametric regression models, such as decision tree (DT), SVM, RF regressor (RFR), extreme gradient boosting (XGBoost), k-nearest neighbors (KNN) algorithm, and linear regression (LR). Supervised learning is applied to data separated into input variables, or features, and an output or target variable. Classification and regression techniques are supervised. Supervised ML algorithms perform algorithm classification. The dataset used for the analysis does not belong to the category of binary classification. Classification algorithms are employed for categorical variables, and regression methods are employed for continuous variables. Regression algorithms can estimate claim amounts for insurance companies. The ML classification algorithms applied to the prediction analysis are SVM, DT, RF, LR, XGBoost, and KNN.
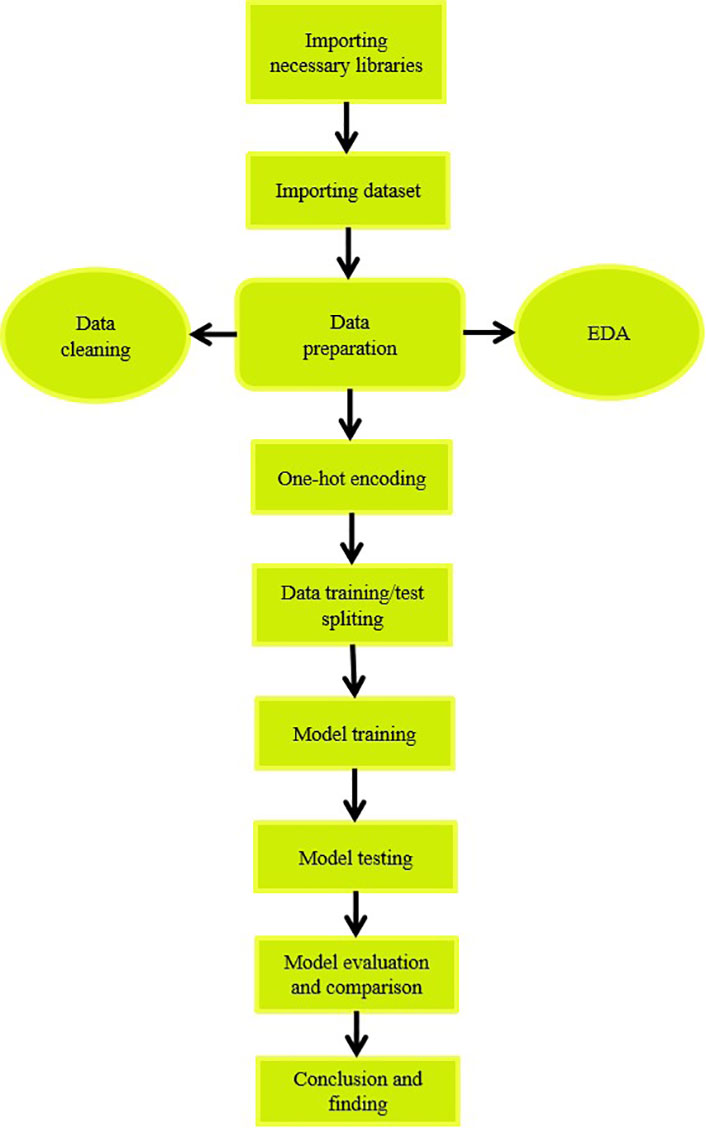
The key goal of designing an AI solution is to explore the simplest and most effective model that has better performance than the rest of the models used in the article. AI model performance mainly differs based on the essential data structure. Once the data preparation is done, the next step proceed with model building. Here, the target variable has discrete values and different regression models are used for future claim prediction. The performance of various algorithms is measured to help professionals and decision-makers choose the best AI solution for their applications. Therefore, the framework is used to execute insurance claim analysis of various algorithms measured depicted in Figure 4.
The target variable is discrete values, and different regression models are used for future claim prediction. Therefore, different performance measures for all models, using parametric and non-parametric regression models, such as DT, SVM, RFR, XGBoost, KNN algorithm, and LR are applied.
After model selection, the training data is used to initially train the models with all available features. Subsequently, classification algorithms are applied, focusing exclusively on the features chosen through feature selection techniques. Lastly, a comprehensive comparative analysis of the models is performed to pinpoint the most effective model for the datasets. This evaluation encompasses the utilization of performance measures and feature importance for distinct algorithms to assess the best performance of the model.
The dataset consists of 1,340 rows and 11 columns, 10 of which are features, and 1 target variable of the dataset for better understanding. After the data is gathered, the next step is data preparation. First, missing values are checked, and then several statistics of the features are performed for the observation. One-hot encoding is done before splitting the training, and the testing dataset is performed for the “claim” to understand the distribution and patterns of different features in different regions, accompanied by additional features.
The data shows gender distribution among insurance claimants, with males representing 50.3% and females slightly lower at 49.7%, suggesting an almost even split in insurance claim ratios between the two sexes. It also displays that diabetic patients account for 47.8% of the claimants, nearly half, compared to nondiabetic patients at 52.2%. Moreover, smokers are 20.6% and 79.4% of non-smokers request for the insurance claim (Table 2).
Insurance claims based on gender, diabetic patients, and smokers
| Variable | Insurance claim (%) |
|---|---|
| Gender | |
| Male | 50.3 |
| Female | 49.7 |
| Diabetic | |
| Yes | 47.8 |
| No | 52.2 |
| Smoker | |
| Yes | 20.6 |
| No | 79.4 |
It is observed that insured individuals in the Southeast USA region report the highest number of insurance claims, followed by those in the Northwest USA, Southwest USA, and Northeast USA (Table 3).
Insurance claims based on region
| Region | Insurance claim (%) |
|---|---|
| Southeast USA | 33.2 |
| Northeast USA | 17.3 |
| Southwest USA | 23.6 |
| Northwest USA | 25.9 |
It is also observed that average insurance claims are around $13,325, and most of the insurance claims range between $1,200 and $14,000. Apart from these observations, the Northeast USA is less likely to file insurance claims than other regions (Tables 3 and 4).
Statistics on attributes in the health insurance database
| Statistics | Age (years) | BMI | Blood pressure (mmHg) | Children | Claim ($) |
|---|---|---|---|---|---|
| Minimum | 18 | 16.00 | 80 | 0 | 1,121.87 |
| Maximum | 60 | 53.10 | 140 | 5 | 63,770.43 |
| Mean | 38.09 | 30.66 | 94 | 1 | 13,325.25 |
| Standard deviation | 11.11 | 6.12 | 11 | 1 | 12,109.62 |
The insurance claims data shows an inverse relationship between the number of children and the likelihood of filing a claim in the USA (Figure 5). It also indicates that claimants within the age group of 50 to 60 years are exclusively female, while those under 25 are exclusively male.
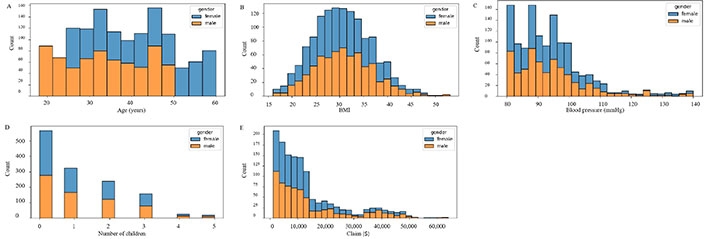
Numeric based on gender data. A. Histogram of age; B. histogram of BMI; C. histogram of blood pressure; D. histogram of children; E. histogram of claim
The regional gender distribution of claims across the USA, with the Southeast USA leading at 33.2%, followed by the Northwest USA at 25.9%, the Southwest USA at 23.6%, and the Northeast USA at 17.3% (Table 3 and Figure 6).
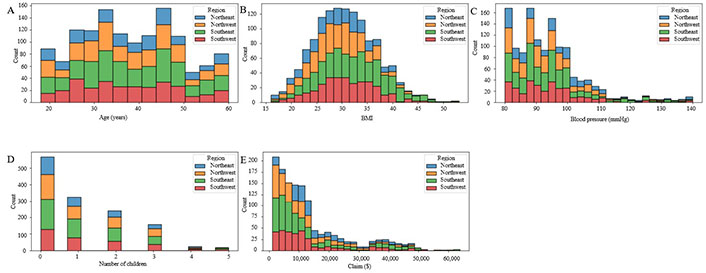
Numeric based on four regions. A. Histogram of age; B. histogram of BMI; C. histogram of blood pressure; D. histogram of children; E. histogram of claim
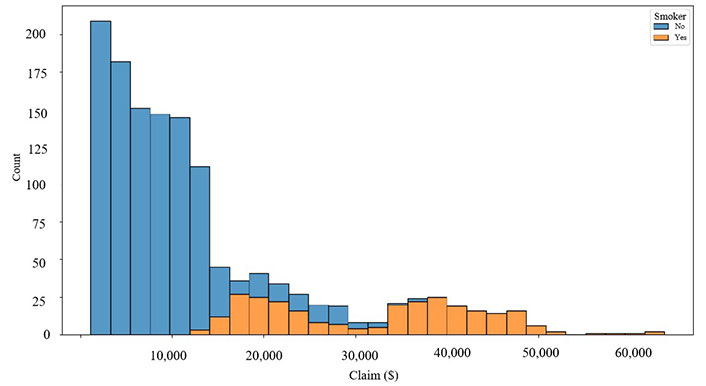
Moving to smoking habits, 20.6% of claims are from smokers, whereas a significantly larger portion, 79.4%, comes from non-smokers (Figure 7). Lastly, the distribution of insurance claims for smoking status and gender indicates that most claims are filed by non-smokers, and the frequency of filing claims is not notably affected by the policyholder’s gender (Figure 8).
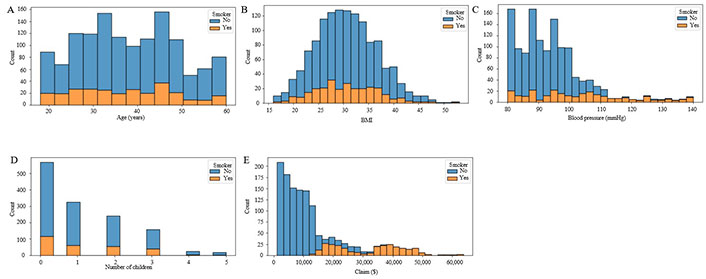
Numeric based on smokers. A. Histogram of age; B. histogram of BMI; C. histogram of blood pressure; D. histogram of children; E. histogram of claim
It is observed that most non-smokers file for claims, while smokers are comparatively less likely to file a claim, and the sex of the policyholders does not matter the same (Figure 8).
There is no significant relationship between charges and age or blood pressure (Figure 9). However, higher charges are associated with a higher BMI and smoking status. Furthermore, there is no distinct trend in the number of children in charge. The information in this dataset, which includes details on age, gender, BMI, blood pressure, diabetes status, number of children, smoking status, and region, offers useful insights into the demographic trends of people who file insurance claims. Determining which populations most urgently want assistance can be used to help corporations and the government make decisions. It is ideally suited for research and ML applications like predictive analytics. Increased computing power: the rise of an extensive environment of new analytics products is a phenomenon.
However, it is challenging to choose the optimum model based on the evaluation metrics listed in Table 5, since certain metrics can be more pertinent in various situations.
Performance measures of algorithms
| Performance measures | Algorithm | |||||
|---|---|---|---|---|---|---|
| SVM | DT | RF | LR | XGBoost | KNN | |
| R-square | 0.10 | 0.57 | 0.77 | 0.68 | 0.79 | 0.31 |
| Adjusted R-square | 0.09 | 0.57 | 0.77 | 0.68 | 0.78 | 0.30 |
| Mean square error (MSE) | 149,194,459.22 | 58,612,767.52 | 30,736,317.10 | 43,614,936.74 | 29,099,812.49 | 94,609,424.94 |
| Root MSE (RMSE) | 12,214.52 | 7,595.89 | 5,544.03 | 6,604.16 | 5,394.42 | 9,726.74 |
| Mean absolute error (MAE) | 8,188.16 | 5,170.15 | 4,066.94 | 5,072.64 | 3,870.03 | 6,769.37 |
| Mean absolute percentage error (MAPE) | 1.01 | 0.72 | 0.66 | 0.71 | 0.63 | 0.98 |
According to the performance measures, the XGBoost and RF models have the highest R-squared with adjusted R-squared values of 0.78 and 0.77, respectively, which together indicate their ability to capture a significant share of the variance in the data. The XGBoost model has the lowest MSE of 29,099,812.49, RMSE of 5,394.42, and MAE of 3,870.03 among the models considered, demonstrating that it has the lowest relative prediction error compared with the other models (Table 5).
Furthermore, the XGBoost model recorded a MAPE of 0.63, while the RF model recorded 0.66, implying the lowest relative prediction error among the models taken into consideration. Moreover, both the RF and XGboost models appear to perform better than the rest of the models. The XGboost model has the highest R-squared and adjusted R-squared values and the lowest RMSE and MAE of the other models, indicating a superior fit to the data. Similarly, the RF model demonstrated low RMSE and MAE with high R-squared and adjusted R-squared values, and these indicators point to the commendable performance of the model. In terms of the XGboost model’s evaluation, the following values of R-squared, adjusted R-squared, MSE, RMSE, MAE, and MAPE are 0.79, 0.78, 29,099,812.49, 5,394.42, 3,870.03, and 0.63, respectively, outperformed the RF model compared to other models.
The above results are displayed in Table 5. The XGBoost model is the better-performing model when compared to the other model. Before selecting the ideal model, it is crucial to consider additional aspects, including model complexity, interpretability, and computing time. As a result, to forecast a customer’s insurance claim, an empirical analysis is conducted. There are six different ML algorithms used to build the model. A finance firm can successfully use the XGboost approach to anticipate a customer’s insurance claim.
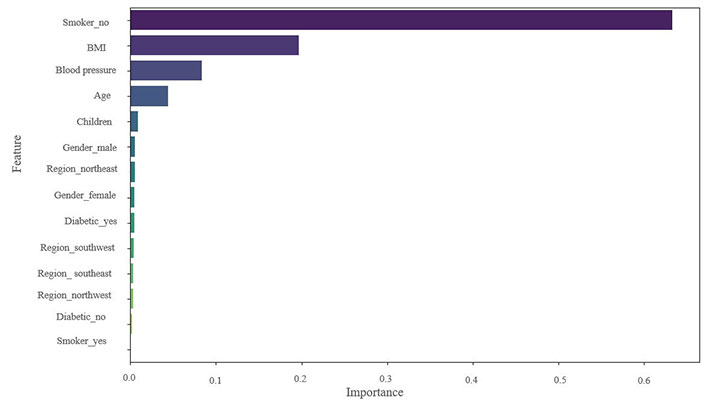
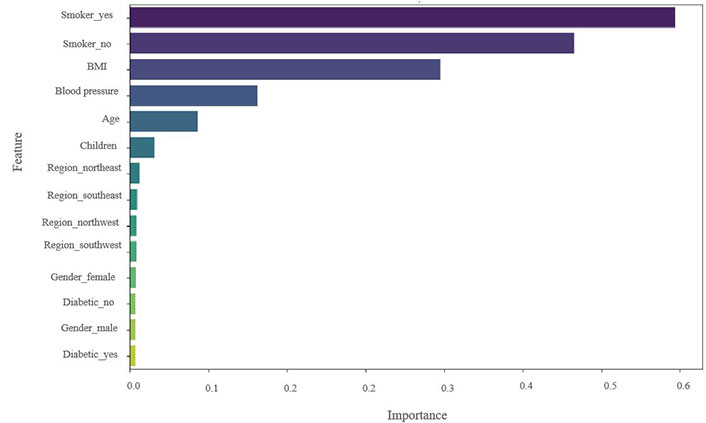
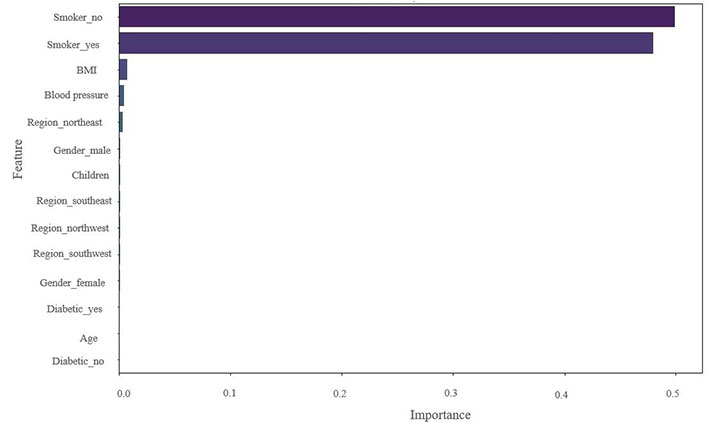
By computing feature importance, the algorithm determines each feature’s contribution to USA insurance claim prediction. By computing feature importance, the algorithm determines each feature’s contribution to USA insurance claim prediction. The significance of every feature in the extension of the predictive models for the insurance claims featured in the study (Figures 10, 11, and 12). A greater value indicates the greater significance of the feature in the model and the relative weights of the explanatory factors that have the greatest influence on forecasting insurance claims. Therefore, it can be concluded that the main feature or variable is the same for the DT, RF, and XGBoost models, but their rankings vary slightly. In this dataset, smoking is a very significant factor for insurance claims in the USA, which is observed in the mentioned three models; BMI and blood pressure value are also key features and significantly impact those models. Age, children, and region have relatively insignificant impacts on the model selection for this dataset. In addition, the comparative influence of each feature target is standardized so that the cumulative sum equals 100%, with a higher value indicating a significant impact on the response variable. Smoking has the highest influence on predicting insurance claims for the RF, XGBoost, and DT models (Figures 10–12). LR, RF, and XGBoost show better claim prediction than the SVM, DT, and KNN, but XGBoost has the best performance among the six models for claim prediction (Table 5 and Figure 12). This methodology can also help review and reduce the company’s budget for insurance coverage.
The result showed that smoking status accounted for a greater share of the explanatory variation than other variables, making it a significant factor in predicting insurance claims. This demonstrates how smoking status must be considered when creating insurance policies and pricing schemes in the USA.
Insurers can automate data processing with AI algorithms, improving efficiency and reducing errors. Insurance claim analysis of the dataset is performed on six ML models. For the dataset used, XGBoost resulted in the best prediction of an efficient insurance claim process for customer behavior and could be used for better anticipation of claim amounts. Then the next best performance model is RF. To anticipate insurance claims more accurately, this study analyzes numerous variables, including smoking, that affect insurance claims across the USA. However, demographics, medical history, lifestyle and behavior, and policy details are important determinants for predicting insurance claims. These characteristics can help to anticipate claims, make appropriate decisions, and reveal insureds’ risk profiles. The degree of accuracy of the data acquired and the privacy concerns of individuals must be balanced. Responsible AI can improve the accuracy of claim processing as well as anticipate a customer’s claim in the USA. If it is not used responsibly, then it can cause bias. As a result, it is crucial to assess an AI model’s performance not only on its accuracy but also on its fairness and transparency. The use of AI for the analysis of health insurance claim data can impact the accuracy of claim processing. Therefore, to avoid biases and discrimination in the processing of insurance claims, it is necessary to think carefully about the responsible use of AI. AI algorithms can identify trends in insurance claim data and determine individuals who will need more medical care in the future. Insurance companies could use this data to modify their pricing and policy designs to more effectively satisfy their clients’ demands. Nevertheless, to prevent possible negative impacts on patients and medical professionals, it is crucial to ensure that the use of predictive models in healthcare insurance is done responsibly and ethically. Health insurance claims processing can benefit from AI and predictive models. To protect insured people’s rights, ethical considerations are crucial. Fairness, openness, data privacy, and accountability should guide model development and deployment. Insurers can use predictive modeling to preserve ethical norms and build confidence by addressing these ethical problems.
The use of responsible AI in analyzing health insurance claims data and predicting healthcare utilization patterns can significantly impact the accuracy of claims processing, health insurance pricing, and policy design in the USA. Through performance measurement and feature importance analysis, the XGBoost model outperforms the best model to ensure accurate predictions over the rest of the algorithms, the role of smoking status, blood pressure, and BMI predicted insurance claims, underscoring their importance in risk assessment and policy pricing. The selection of the appropriate model should also include model complexity and computational complexity. The output of the models can assist insurance providers in making deft pricing and policy design choices, resulting in more effective and efficient healthcare delivery. This study demonstrates how the results of these models can help insurance companies make wise decisions about pricing and policy design, leading to more effective and efficient healthcare delivery. It is crucial to ensure justice, transparency, and accountability during the development and deployment of these models to prevent any biased results. Predictive modeling and AI have enormous potential applications in the healthcare sector, but it is also crucial to uphold ethical and responsible standards. In conclusion, the healthcare sector in the USA could benefit significantly from the prudent use of AI for insurance claim forecasting.
This study also has some limitations. First, small sample sizes increase sampling bias because the data may not accurately represent the population. This can affect claim processing and prediction accuracy. It is crucial to remember that the study only looked at some variables and might not have adequately reflected the full complexity of variables that influence insurance claims. The model can detect more population patterns and variability with a larger sample size. Second, data privacy is essential in insurance claim data analysis. Insurers are in charge of handling personal, financial, and health data. Insurers should observe strong data privacy rules to ensure data confidentiality and security. Analyzing multiple variables helps predict insurance claims. Sociodemographic criteria, medical history, lifestyle and behavior, and policy details are important variables that depend on the insurance type and data. Therefore, these characteristics can reveal insured persons’ risk profiles and anticipate insurance claims. It is crucial to balance the level of insurance claim data and uphold individual privacy concerns. Furthermore, it is critical to consider any potential moral dilemmas brought on by the application of such predictive models. There can also be opportunities to size and apply advanced ML techniques to analyze and improve the current models. Third, more data must be gathered to increase the sample size and boost the model’s precision. Lastly, to develop a more accurate model, it is needed to investigate more external variables, such as economic indicators, that might affect the target variable and monitor performance over time to ensure its accuracy. The future scope of the research involves employing more ML models to discover the best AI model to predict claim success or failure and compare predictions to the actual results of insurance claims.
AdaBoost: adaptive boosting
AI: artificial intelligence
BMI: body mass index
DT: decision tree
EDA: exploratory data analysis
KNN: k-nearest neighbors
LR: linear regression
MAE: mean absolute error
MAPE: mean absolute percentage error
ML: machine learning
MSE: mean square error
RF: random forest
RMSE: root mean square error
SVM: support vector machine
XGBoost: extreme gradient boosting
AA: Conceptualization, Data curation, Formal analysis, Methodology, Software, Writing—original draft, Writing—review & editing. VRP: Supervision, Validation, Writing—review & editing. All authors read and approved the submitted version.
The authors declare that they have no conflicts of interest.
Not applicable.
Not applicable.
Not applicable.
The datasets analyzed for this study can be found in Kaggle by Sumit Kumar Shukla (https://www.kaggle.com/datasets/thedevastator/insurance-claim-analysis-demographic-and-health).
Not applicable.
© The Author(s) 2024.
Copyright: © The Author(s) 2024. This is an Open Access article licensed under a Creative Commons Attribution 4.0 International License (https://creativecommons.org/licenses/by/4.0/), which permits unrestricted use, sharing, adaptation, distribution and reproduction in any medium or format, for any purpose, even commercially, as long as you give appropriate credit to the original author(s) and the source, provide a link to the Creative Commons license, and indicate if changes were made.

Ard Hendriks ... Sil Aarts
Kun Li ... Visara Urovi
Yuyang Yan ... Visara Urovi
Aleksander K Cherkashin, Natalia E Krasnoshtanova