Original Article

Affiliation:
1“Medical Technologies” JSC (“Health 365” Clinic), 620075 Yekaterinburg, Russia
2Sensor Technologies Center, Urals State University of Economics, 620144 Yekaterinburg, Russia
Email: yankaz@yandex.ru
ORCID: https://orcid.org/0000-0002-2332-6826
Affiliation:
3Department of Mathematics, Mechanics and Computer Science, Institute of Natural Science and Mathematics, Ural Federal University, 620062 Yekaterinburg, Russia
ORCID: https://orcid.org/0009-0006-1111-3643
Affiliation:
2Sensor Technologies Center, Urals State University of Economics, 620144 Yekaterinburg, Russia
ORCID: https://orcid.org/0000-0001-8753-4993
Explor Digit Health Technol. 2025;3:101157 DOI: https://doi.org/10.37349/edht.2025.101157
Received: November 30, 2024 Accepted: June 11, 2025 Published: July 15, 2025
Academic Editor: Zafar Said, University of Sharjah, United Arab Emirates; Atanas G. Atanasov, University of Vienna, Austria
Aim: Oxidative stress (OS) remains an intensively studied scientific problem. The quantitative measurement of OS is an unsolved task, largely due to the existence of numerous complex, non-linear interactions of its components, which can not be measured by traditional statistical methods. Modern mathematical processing based on artificial intelligence (AI) could be a promising method of OS assessment in medicine. The aim of the study was to investigate the potential possibilities of using multilayer neural networks to improve the diagnostic informativeness of the OS indicator—antioxidant (AO) activity (AOA) in patients with cardiovascular diseases (CVDs).
Methods: A cross-sectional study of a sample of 856 people, healthy volunteers and several groups of patients with CVDs (hypertension, including those complicated by coronary heart disease and/or cerebral ischemia, chronic cerebral ischemia), was carried out. The potentiometric method of determining the OS indicator, index of blood serum AOA, was used in comparison with a number of laboratory tests and clinical data. After the results of linear statistical evaluations were not satisfactory enough, а multilayer perceptron classifier was constructed for data analysis.
Results: By training a neural network, it was possible to assign a patient to one of the above-mentioned groups with 85% accuracy on the basis of 8 parameters selected from all the patients’ clinical and laboratory data, including the AOA value.
Conclusions: The use of multilayer neural networks can improve the diagnostic value of information obtained during the measurement of AOA index, in combination with simple laboratory tests in patients with CVDs. The application of AI algorithms is a promising tool to improve the laboratory measurement of OS and a potential solution to overcome the contradictions in the existing approaches to the evaluation of OS.
Redox reactions are essential to life—from the conversion and storage of light energy by photosynthesis in green plants to tissue respiration in mitochondria of living organisms. It is well known that they are chemical reactions in which atoms change their oxidation degrees—the processes of oxidation (losing electrons) and reduction (gaining electrons) by different atoms occur simultaneously, hence the term “redox”. Disruption of redox processes plays a key role in the pathogenesis of numerous diseases and common types of pathological processes such as inflammation, ischemia, carcinogenesis, necrosis, dystrophy, etc. [1–3], leading to the development of a condition commonly referred to as oxidative stress (OS), which is a fundamental mechanism arising from redox reactions. Initially OS was considered as a damaging oxidative effect of reactive oxygen species (ROS) and reactive nitrogen species (RNS) and an imbalance between overproduction of these active substances [reactive oxygen and nitrogen species (RONS)] and their elimination by antioxidant (AO) defense system, the later consists of low molecular weight AOs and enzymes that catalyze AO reactions [4]. Increased levels of RONS, which are high-reactive substances, lead to direct oxidative damage to biological molecules (DNA, lipids, proteins, carbohydrates), cells, and tissues. But OS is also realized through disturbances in inter- and intracellular regulation, known as redox regulation [5]. Redox regulation is normally carried out by constantly formed small concentrations of ROS and RNS, and includes regulation of signaling molecules, specific metabolic pathways and gene activity, regulation of different enzymes [5–11]. Redox regulation disturbances play an important role in different pathologic processes, such as cancer, neurodegenerative disorders, atherosclerosis, inflammation, etc. [12]. According to modern definition [13], OS should be considered as “an imbalance between oxidants (Oxs) and AOs in favor of Oxs, resulting in impaired redox signaling and control and/or molecular damage”.
OS is a complex process that has many non-linear interacting constituents. Numerous methods proposed for assessing OS are based on approaches [14, 15] to measuring concentrations of individual substances (ROS, RNS, AOs), integral assessments of the balance within the Ox/AO system, determining the effects of ROS and RNS on biological structures and individual molecules (biological trace). A current trend in OS research focuses on examining the effects of specific Oxs (reactive forms) and individual AOs on distinct pathways and mechanisms of redox regulation [16]. However, a significant challenge remains: the lack of a universal measurement standard, coupled with the frequent use of non-standardized methods and units of measurement.
The correct measurement of RONS is limited by high reactivity and very short lifespans of these reactive species in biological fluids, insufficient measurement sensitivity of many analytical techniques, and instability of RONS in vitro [17]. The biologic effects of RONS cannot be considered as an independent diagnostic feature or the sole cause of OS [18], due to the non-specificity of RONS damaging effects and significant variations in the response of AO systems. Since it is difficult to assess the influence (effect) of a specific reactive substance, a generalized approach based on cluster analysis of different ROS has been proposed [19], which has demonstrated expected association of some diseases (ischemia/reperfusion and heart failure, amyotrophic lateral sclerosis and multiple sclerosis). The authors emphasize that additional diagnostic information can be obtained by searching for biomarkers that are indicators of a disease mechanism common to several pathologies [19].
One of the ways to evaluate OS is to measure the various parameters of the AO defense system, mainly by two approaches [20]. The first approach, well described in the reviews [14, 21], entails directly measuring the levels and/or activity of particular high-molecular enzymes and compounds within the glutathione system, superoxide dismutase, catalase, glucose-6-phosphate dehydrogenase, decarboxylating malate dehydrogenase, isocitrate dehydrogenase, redox-sensitive transcription factors, uric acid, ascorbic acid, tocopherols, polyphenols, carotenoids, and retinol. The second, “integrated” approach is preferable for evaluating the overall characteristics of the AO defense system, as it considers a wide range of AO compounds, variations in mechanisms, and the potential for synergistic effects within the body.
One of the directions of the “integrated” approach to the assessment of OS is the evaluation of AO properties of biological objects, in particular the use of potentiometric method for measuring the AO activity (AOA) of a biological sample [22–26]. This method has previously been used to study AOA of biological samples—plasma, blood, saliva, seminal and follicular fluid, skin and its normal ranges. The term “antioxidant activity” (a) is defined as a function of the activity coefficient (f) and concentration (c), represented by the equation a = fc. The determination of AOA can be achieved through two main principles: electron transfer or hydrogen atom transfer [27, 28]. The obvious fundamental property of OS is its electrochemical nature (electron transfer in redox reactions). Accordingly, electrochemical methods of determination, in particular the potentiometric method used by our research group, seem to be one of the most appropriate to the nature of the phenomenon under study.
Nevertheless, there is serious criticism of the concept of “integrated” approaches in AO analytics. The main criticism is that universal values measured in biological samples do not provide useful information about the state of the organism, and their use should be avoided in favor of evaluating the activity of individual enzymes of the AO defense system and patterns of AO molecules [29]. It was emphasized that enzymes of the AO defense system, rather than low molecular weight AOs (like AO vitamins), play a significant role in the body’s AO defense, and the role of the latter is often overestimated. The opinion is expressed that the terminology describing the OS should be based on a strict biochemical justification of the studied processes, indicating, if possible, the specific chemical entity of the Ox is known [5, 29, 30]. Such quantitation of OS requires the practically impossible measurement of both the rate of RONS (free radicals) production and the rate of their elimination [31]. The independent value of the study of individual components of the AO defense system may also be debatable, since AO protection against OS is complex and operates at multiple levels. AOs are working not only within cells but also in blood plasma, intercellular spaces, cerebrospinal fluid, synovial fluid, and lymph. AOs operate through various mechanisms and possess different chemical properties [32].
Thus, there are serious contradictions in approaches to assessing OS. One point of view is based on the fact that the specific chemical species involved in a biological process should be clearly identified, and considerations should be made regarding whether the observed effects align with their reactivity, lifespan, generated products, and in vivo fate, whenever possible [15]. However, this approach has its limitations; drawing conclusions from a single test about a complex, multi-component phenomenon like OS is challenging. Most methods for quantifying “the level of OS”, such as lipid peroxidation products, specific proteins, AOs, and fragmented DNA, rely on steady-state concentrations of various biomarkers, and the data obtained from various methods often correlate poorly. The level of “OS” is largely dependent on the detection method used and should not be regarded as a reliable clinical tool based on any single available method [33]. Therefore, another view is based on the fact that various OS biomarkers may have distinct biological fates, and AOs can affect different types of OS in diverse ways [31]. Consequently, there is no singular factor capable of fully describing the overall redox status.
In the MARK-AGE study, the effects of twelve different low molecular weight AOs on OS status were assessed using eight different biomarkers of oxidative damage (such as malondialdehyde, protein carbonyls, and 3-nitrotyrosine) in a cohort of 2,207 age-stratified participants [34]. The findings from this study suggest that low molecular weight AOs contribute minimally to the redox state, and the concentration of a single biomarker cannot adequately reflect the overall redox status. Based on the poor correlations between biomarkers and the varying associations between biomarkers and low molecular weight AOs, the authors propose that these biomarkers may represent distinct processes and types of OS. Theoretically, integrating multiple biomarkers to create a common index of redox status is possible, but this approach may be too complex to implement as a routine assay [34]. As a similar approach, it was proposed to include a list of known metabolites previously identified in different oxidative processes in metabolomic studies to better understand the mechanisms of OS. Simultaneously, providing measurement of the levels of as many different small molecule oxidation products and AOs as possible from different sources (blood, blood cells, saliva, urine) in order to obtain a more comprehensive and truer picture of the state of OS and AO status is recommended [35].
It is obvious that OS is a complex, multifactorial phenomenon, the result of non-linear interactions of many variables with changing chemical properties. Accordingly, attempts to study OS by measuring a single metabolite, AO, ROS, or RNS cannot provide a general understanding of the overall “big picture” of OS. The development of a cohesive approach to defining and measuring OS parameters remains a critical issue.
In our early experiments to measure plasma AOA in patients with various pathologies, we have found that the presence of diseases leads to a certain decrease in AOA, but not always statistically significant (Figure 1). Our attempts to find reliable differences in AOA in various diseases have failed, and the data have not been previously published. However, the lack of significant differences in AOA between patients with different diseases is interesting as it can demonstrate the complexity of the OS phenomenon, its multifactorial nature. A certain pattern of plasma AOA decrease with age was noted, but there is insufficient data to judge the true decrease, the degree of chronic disease burden increases with age, which can certainly affect the level of AOA. We also did not obtain significant differences in AOA by sex, although a certain tendency for higher levels of AOA was observed in young women [22].
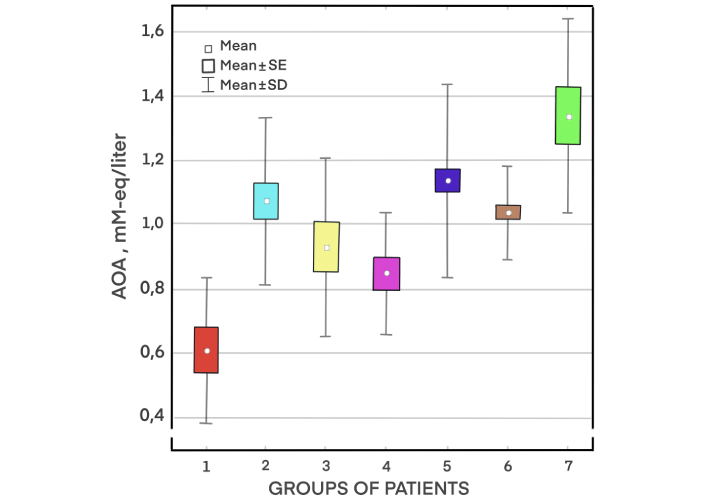
Plasma antioxidant activity (AOA) in patients with different pathologies. Groups of patients: (1) malignant neoplasms (metastatic cancer); (2) diabetes mellitus; (3) inflammatory diseases of upper respiratory tract; (4) acid-dependent diseases of gastrointestinal tract; (5) hypertension (HT) and cardiovascular diseases (CVDs; coronary heart disease, atherosclerosis of cerebral arteries) without obesity; (6) HT in combination with disorders of carbohydrate metabolism (metabolic syndrome and obesity); (7) relatively healthy people
Later, we have proposed [25] the reference values for normal AOA for the potentiometric method of AOA measurement we use in our practice. The differences in blood serum AOA of different groups of patients and healthy volunteers were demonstrated, too. The data are summarized in Table 1 for clarity. However, the promising data obtained from the group of patients with cancer need further in-depth study. The data within the group of cardiovascular diseases (CVDs) patients with different severity and comorbidity of pathology did not differ with sufficient reliability, i.e. the expected correlation between the AOA index, which we propose to use to assess the severity of OS, and the severity of CVDs was not demonstrated. More of all, no significant differences in serum AOA levels, according to the Student’s t-test, were observed between the subgroups of patients with CVDs [subgroups with different stages of hypertension (HT)]. There was also no correlation between AOA values and several laboratory tests [such as blood glucose, creatinine, hemoglobin, hematocrit, white blood cell and red blood cell accounts, total cholesterol, high-density and low-density lipoproteins (HDL and LDL)] in patients with different stages HT, although in general in the group of patients with HT the positive moderate correlation (Pearson linear correlation coefficient, r = 0.48) of serum AOA with the level of serum uric acid was obtained [25].
Serum antioxidant activity (AOA) values in different groups of patients (according to [25])
| Group of patients | AOA value, mM-eq/liter |
|---|---|
| Healthy people | 1.42 ± 0.29 |
| Patients with cardiovascular diseases (CVDs) [hypertension (HT)] | 1.09 ± 0.29 |
| Patients with cancer | 0.70 ± 0.21 |
OS, which shares basic mechanisms related to the imbalance in the AO and RONS system and the damaging effect of the latter, should also have undoubted differences in different pathologies. For example, chronic cerebral ischemia may be associated with different brain damage and coronary disease with changes in myocardial structure and function. These conditions have distinctive clinical features, require different approaches to diagnosis and treatment, and have different prognoses. However, in the case of integrated values assessment, we do not have visible “qualitative” markers of OS, nor quantitative measures of its assessment in each disease, and we can only make general statements about the presence of OS (decrease in AOA) and the difference of this indicator from the norm, which seems insufficient. Thus, the drawback of using integral values in the study of OS is the lack of sufficient information about the severity of the process and the probable involvement/damage of specific organs and systems. As it stands, the information is insufficient for clinical use; we cannot say with certainty that the AOA indicator, considered as a biomarker of OS, is indicative of a specific problem in an individual patient, as changes in AOA may be due to a variety of causes.
Obviously, for various reasons, conventional statistical methods are not always sufficient for a complete assessment of all non-linear interactions within the OS phenomenon. Therefore, the exploration of novel measurement techniques and assessment methods for OS parameters is essential. Artificial intelligence (AI), combined with innovative mathematical processing methods, can potentially provide new valuable information about the nature and characteristics of this complex phenomenon, which consists of a series of interrelated and often hidden patterns, and enhance our ability to analyze and compute these patterns and reveal unexpected insights.
AI refers to the simulation of human intelligence in machines [36, 37] in a way that machines can perform independent activities that would otherwise require human reason (intelligence) [38]. Generally, such activities should demonstrate learning, communication, and decision-making abilities in a manner that replicates and even surpasses human intelligence [39]. The components of AI are machine learning (ML), deep learning (DL) models and neural networks [37], natural language processing, reinforcement learning, multimodal learning, and computer vision—analysis of biomedical images and videos [40, 41]. The main directions for the use of AI in medicine are pre-operative care, screening and detection [38], the development of new drugs [40, 42], selection of drugs and their doses for personalized optimal treatments [43], risk assessment and prediction of disease development [44, 45], automated image analysis in radiology [46], and uncovering new biomarkers [47].
Research on new biomarkers using AI is being intensively developed by analyzing and comparing large amounts of information (big data), including multiple clinical and laboratory parameters in a large number of patients. Specialized registries are frequently used to enhance the organization and accessibility of information. The study of laboratory indicators with the help of AI makes it possible to identify new ways of early diagnosis and prognosis in various diseases—cardiovascular, oncological, infectious-inflammatory, and others. A number of works have been published in this area, in which the application of AI algorithms demonstrates impressive results. In the work of Weng et al. [48], 2017, various ML algorithms were used to analyze data (laboratory tests in compare with several clinical, instrumental and demographic data) from a ten-year follow-up of a sample of 378,256 patients who were initially free of CVDs, but during the entire follow-up period, cardiovascular events were recorded in 6.6% of all cases. The authors found that all the ML algorithms used were better at identifying the risk of CVDs developing as well as such risk absence in compared with the commonly used risk prediction algorithm [48]. In the work of Alaa et al. [49], 2019, the data from 423,604 participants without CVDs at baseline in the UK Biobank was used, and an ML algorithm-based model (AutoPrognosis algorithmic tool) for predicting CVDs risk based on 473 variables available from the data bank was developed. AutoPrognosis tool uncovered novel predictors of CVDs and improved risk prediction compared to previously established models (Framingham score, Cox proportional hazards model), which have a limited number of indicators [49]. Extremely serious importance is attached to the use of ML algorithms in cancer diagnosis, in particular for the early identification of cancer-related genetic mutations and aberrant protein interactions [50]. On a sample of 6,505 cases of patients with non-small cell lung cancer, ML methods were used to compare socio-demographic, anthropometric and simple clinical data, laboratory parameters, their fluctuations and change over time. The resulting MES model was more accurate in detecting and early diagnosis of lung cancer than the standard eligibility criteria for lung cancer screening. Based on clinical characteristics and laboratory tests performed 9–12 months before clinical cancer staging, the MES model was able to detect lung cancer with sensitivity and specificity of 40.3% and 95%, respectively, with a positive test result indicating a 13-fold increase in the likelihood of lung cancer [51]. ML-based approach, based on random forest and support vector machine algorithms, was implemented to conduct a comprehensive analysis of 42 inflammatory biomarkers in urine samples. As a result, a set of 4 immunological biomarkers of greatest relevance in determining the presence of urinary tract infection was identified [52]. ML has also become central to biomarker discovery from proteomics data. Mann et al. [53], discussing the potential of new protein-based biomarkers in medicine, note that the data obtained in the search for new biomarkers may exceed the currently used indicators of even the most reliable and best tests.
“Discovery of biomarkers was recently shifted its focus toward digital, non-traditional biomarkers that often use physiological, psychological, social, and environmental data to derive an intermediate biomarker. Such biomarkers, by triggering smart services, can be used in a clinical trial framework and eHealth or digital therapeutic services.” [54]. One of the promising applications of AI lies in the identification of biomarkers for OS and the assessment of OS itself. Perhaps, the application of AI will make a breakthrough in the diagnosis of OS, allow levelling all contradictions, opening all white spots, and contribute to the formation of a single agreed position on approaches to the measurement and assessment of OS.
The aim of the study was to investigate the potential possibilities of using AI (multilayer neural networks) to improve the diagnostic informativeness of the OS indicator—AOA in patients with CVDs.
In our study, we analyzed a sample of 856 patients—healthy volunteers and patients with CVDs. The patients of Caucasian ethnicity were enrolled in the study. Inclusion of participants in the study and data collection was done from 01/06/2018 to 31/05/2020. The present study was of an observational cross-sectional nature, employing “convenience sampling” of patients by offering participation in the study to patients who attended their doctor’s appointments with queries regarding blood pressure control, treatment, and prevention of HT. Healthy individuals were selected from their annual medical check-ups. During this period, 856 study participants who met the inclusion criteria and agreed to participate in the study were enrolled.
The study was approved by the Ethical Committee of “Medical Technologies” JSC, on the basis of which the patients were monitored. All patients were included in the study after signing informed consent.
All healthy volunteers and patients with CVDs underwent a general therapeutic examination with medical history collection and registration of anthropometric and vital signs, laboratory clinical and biochemical tests (total blood count, glucose, total cholesterol, HDL and LDL), with simultaneous assessment of AOA of serum. Additionally, electrocardiographic study and pulse wave velocity study [12-lead electrocardiograph POLY-SPEKTR-8/E with the connected module Poly-Spectr-SRVP (Neurosoft Ltd., Russia)], carotid artery ultrasound [Philips IU-22 ultrasound scanner (Philips N.V., Netherlands) with the linear probe with the frequency of 5–12 MHz] were performed according to the standard conventional methods.
The study included patients diagnosed with HT stage 1–3 according to the criteria of the European Society of Cardiology; the presence of verified (medical records, objective examination, results of additional research methods, and above-mentioned instrumental tests) signs of other CVDs—chronic cerebral ischemia (cerebral atherosclerosis), chronic coronary heart disease—was taken into account. Patients, included in study, received standard therapy including hypotensive drugs, statins, and antianginal drugs. Patients taking nutritional supplements, AO complexes, AO class drugs, psychotropic drugs, weight correction drugs, adhering to special dietary rules (fasting, ketone diet, etc.) for weight correction were excluded from the study. Patients with concomitant metabolic diseases—diabetes mellitus, gout, severe morbid obesity; patients with malignant neoplasms at the time of inclusion in the study or within 5 years preceding the study; patients who had suffered an acute vascular accident (myocardial infarction, stroke, transient ischemic attack) within 6 months before inclusion in the study; patients with severe lung, renal, and hepatic failure were excluded from the study.
The following data were collected for each patient:
gender: male or female;
age;
weight, height [body mass index (BMI) was calculated];
indicators of AOA:
serum AOA;
serum AOA (after heating up to 37°C);
blood glucose level;
hemoglobin level;
red blood cell count;
white blood cell count;
serum cholesterol level;
serum creatinine level;
serum iron concentration;
serum uric acid concentration;
serum HDL level;
serum LDL level.
Based on the clinical and instrumental data obtained, all patients were assigned to one of the clinical groups, according to International Classification of Diseases-11 (Table 2).
The characteristics of the study groups
| Group | International Classification of Diseases-11 code | Number of patients | Age, years | BMI | Males (number/percent) | Females (number/percent) |
|---|---|---|---|---|---|---|
| Healthy people | QA00.5 | 209 | 40.31 ± 0.61 | 24.98 ± 0.44 | 79/37.80 | 130/62.20 |
| Chronic cerebral ischemia | BD55 | 55 | 54.91 ± 1.51 | 26.61 ± 0.69 | 19/34.55 | 36/65.45 |
| Hypertension | BA00 | 309 | 49.94 ± 0.65 | 30.01 ± 0.37 | 174/56.31 | 135/43.69 |
| Hypertension + chronic cerebral ischemia | BA00 + BD55 | 156 | 57.38 ± 1.04 | 29.30 ± 0.55 | 79/50.64 | 77/49.36 |
| Hypertension + coronary heart disease | BA00 + BA50 | 51 | 59.71 ± 2.07 | 30.66 ± 0.85 | 32/62.75 | 19/37.25 |
| Hypertension + chronic cerebral ischemia + coronary heart disease | BA00 + BD55 + BA50 | 76 | 66.21 ± 1.42 | 29.66 ± 0.91 | 47/61.84 | 29/38.16 |
BMI: body mass index
Blood sampling of patients with HT and healthy volunteers was performed at fasting in the early morning hours (7.00–8.30) to avoid starvation-induced OS [25]. The patients were instructed to avoid smoking, fitness, and psychological stress on the day of blood sampling. Alcohol consumption and overeating were excluded on the eve of the study. Medication intake on the day of the study was postponed until after the blood collection. Blood was taken by venipuncture at the bend of the elbow joint into polyethylene terephthalate vacuum tubes containing SiO2 as coagulation activator (№42000695 – 0344200008816000012, Chengdu Puth Medical Plastics Packaging Co., Ltd., China). To obtain serum, the blood was centrifuged at a speed of 3,500 rpm for 15 min using centrifuge SM–6M (SIA ELMI, Latvia). To determine serum AOA, supernatant fluid was used.
Blood serum AOA value was determined by the potentiometric method, described in our previous work [22]. Serum sample was introduced into the solution with pH 7.4, containing 0.01 М K3[Fe(CN)6], 0.0001 М K4[Fe(CN)6], qualified as “clean”; 0.0545 М Na2HPO4, and 0.0121 М KH2PO4, qualified as “clean for analysis” (all reagents produced by Reachim Ltd., Russia). Measurements were carried out at the room temperature (23° ± 3°С) and then after heating up to 37°С, using the potentiometric analyzer “Antioxidant” (number in the State Register of Measuring Instruments 56031-13, Specification TY 4215-002-30830710-2013, Antioxidant Ltd., Russia). Analysis was performed using a two-electrode cell comprising a platinum screen-printed electrode TPE type I SMR.08-000-00 (Iva Ltd., Russia), which served as an indicator electrode and a silver/silver chloride electrode Ag/AgCl, 3.5 M KCl type EVL 1M3.1 (JSC Gomel Plant of Measuring Devices, Belarus) as a reference electrode.
The source of information about АОА is the electrode potential shift in the mediator system K3[Fe(CN)6]/K4[Fe(CN)6], which is observed when AOs (the sample) are added into the solution. This shift results from changes in the concentration of mediator oxidized/reduced forms during the reaction: Fe(III) + АО = Fe(II) + AOox where AOox means the AO oxidation product. АОА was expressed in mМ-eq/liter and calculated applying equation:
where
A full blood count blood test was performed at BC-6800 hematology analyzer (Shenzhen Mindray Bio-Medical Electronics Co., Ltd., China) and biochemical tests were performed at BA-400 biochemical analyzer (Biosystems S.A., Spain).
We initially conducted a study to identify a set of parameters that would allow for highly reliable classification into the specified diagnostic groups. The dataset was split into two subsets: a training set comprising 513 patients, and a test set consisting of the remaining 343 records.
Following the initial model construction and hyperparameter tuning, we performed stratified 5-fold cross-validation to assess the model’s performance. The results of this evaluation are summarized below.
After normalizing and cleaning the data and conducting primary correlation analysis, which indirectly confirmed the correctness of the primary analysis, we built a series of neural network classifiers [multilayer perceptron (MLP) classifier] for each subsystem of features. In numerical experiments, we used the sigmoid activation function for neurons in the hidden layers:
as well as the hyperbolic tangent activation function:
The number of neurons in the hidden layer was varied in each series. Training was performed using the backpropagation algorithm. A series of numerical experiments was conducted to select training parameters for each type of network architecture. In all models, the softmax activation function was used at the output layer to transform the raw output scores into class probabilities suitable for multiclass classification. We carefully examined the confidence levels of the model’s predictions and confirmed that all test samples were classified with sufficient certainty. No uncertain or borderline cases were observed.
The obtained laboratory data are presented in Table 3.
Laboratory data in different study groups
| Laboratory value | Healthy people | Chronic cerebral ischemia | Hypertension | Hypertension + chronic cerebral ischemia | Hypertension + coronary heart disease | Hypertension + chronic cerebral ischemia + coronary heart disease |
|---|---|---|---|---|---|---|
| Serum AOA, mM-eq/liter | 1.24 ± 0.13 | 0.96 ± 0.12 | 1.02 ± 0.03 | 1.01 ± 0.05 | 1.16 ± 0.09 | 1.09 ± 0.05 |
| Serum AOA (after heating up to 37°C), mM-eq/liter | 1.41 ± 0.11 | 1.11 ± 0.11 | 1.29 ± 0.07 | 1.20 ± 0.11 | 1.28 ± 0.15 | 1.32 ± 0.11 |
| Blood glucose, mM/liter | 5.04 ± 0.14 | 5.04 ± 0.19 | 5.93 ± 0.19 | 6.31 ± 0.36 | 5.84 ± 0.16 | 5.96 ± 0.27 |
| Hemoglobin, g/liter | 141.08 ± 11.50 | 139.18 ± 5.37 | 145.40 ± 1.54 | 140.72 ± 2.33 | 145.33 ± 4.90 | 141.77 ± 1.96 |
| Red blood cells, × 1012/liter | 4.66 ± 0.05 | 4.53 ± 0.19 | 4.77 ± 0.05 | 4.69 ± 0.06 | 4.85 ± 0.13 | 4.74 ± 0.96 |
| White blood cells, × 109/liter | 5.96 ± 0.17 | 6.19 ± 0.49 | 6.34 ± 0.17 | 6.59 ± 0.22 | 7.21 ± 0.28 | 7.01 ± 0.29 |
| Cholesterol, mM/liter | 4.76 ± 0.12 | 5.20 ± 0.11 | 5.54 ± 0.12 | 5.58 ± 0.18 | 5.39 ± 0.21 | 5.15 ± 0.15 |
| HDL, mM/liter | 1.39 ± 0.12 | 1.54 ± 0.50 | 1.41 ± 0.06 | 1.58 ± 0.26 | 1.38 ± 0.11 | 1.15 ± 0.05 |
| LDL, mM/liter | 3.30 ± 0.18 | 3.51 ± 0.09 | 3.46 ± 0.12 | 3.76 ± 0.30 | 3.18 ± 0.53 | 3.21 ± 0.25 |
| Iron, µM/liter | 16.48 ± 0.19 | 16.21 ± 0.66 | 16.92 ± 0.18 | 16.43 ± 0.28 | 16.90 ± 0.57 | 16.12 ± 0.43 |
| Creatinine, µM/liter | 88.75 ± 3.96 | 74.64 ± 4.37 | 88.44 ± 2.50 | 87.45 ± 3.17 | 89.57 ± 5.45 | 93.90 ± 4.21 |
| Uric acid, µM/liter | 399.19 ± 38.87 | 324.20 ± 35.40 | 332.29 ± 14.96 | 327.51 ± 30.67 | 383.42 ± 43.66 | 359.12 ± 21.99 |
AOA: antioxidant activity; HDL: high-density lipoproteins; LDL: low-density lipoproteins
Several clinical and biochemical parameters, including age and cholesterol levels, were found to be significantly lower in the group of healthy people, compared to the groups of patients with CVDs. AOA indicator was significantly higher in the group of healthy volunteers. Statistical significance was assessed using the Student’s t-test, with a threshold of P < 0.05 considered indicative of meaningful group differences.
To further explore relationships between variables within the patient groups, a correlation analysis was performed. Pearson’s correlation coefficient was used to assess pairwise associations among parameters. The results demonstrated no strong correlations between the studied features, indicating relative statistical independence among the measured variables in different groups of patients with CVDs.
In general, the data we have obtained repeated the trends previously demonstrated by us in patients with different stages of HT [25], namely, the lack of correlation between AOA values and other laboratory tests in the groups of patients with CVDs. Finding no correlation between parameters implies the absence of linear relationships. But, as discussed in the Introduction, the mechanisms of OS imply the existence of many non-linear relationships that cannot be assessed by standard methods of statistical processing.
The cohort of 856 people was analyzed using ML methods discussed above.
As a result of training the neural network using the back propagation algorithm, a series of numerical experiments, the following feature subsystem of 8 parameters was selected:
gender: male or female;
age;
serum cholesterol level;
serum uric acid concentration;
serum AOA (at room temperature);
serum AOA (after heating up to 37°C);
hemoglobin level;
blood glucose level.
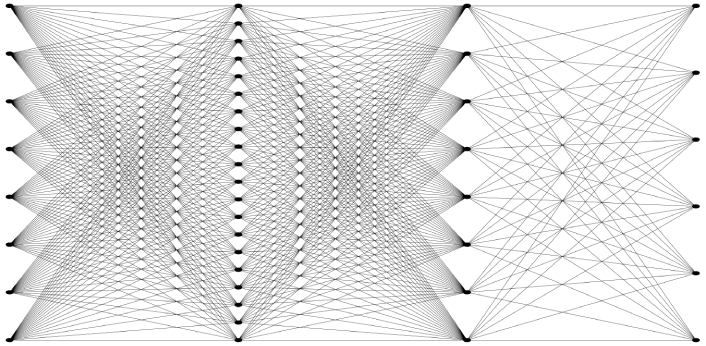
An MLP classifier of configuration 8–20–8–6 (number of neurons in the input, hidden, and output layers) was constructed, which provided high accuracy in making correct diagnoses (Figure 2).
The classifier was implemented using the SKLearn library in the Python programming language.
With the computational resources available to us at that time, the accuracy on the test set reached 85%. That is, our neural network training allows us to assign a patient to one of the above-mentioned groups with 85% accuracy on the basis of the 8 parameters selected above, including the results of the simplest laboratory tests and AOA value.
A comprehensive grid search was conducted to identify the optimal hyperparameters for the MLP model. The best-performing configuration was characterized by the following parameters: alpha = 0.01, learning_rate init = 0.01, and momentum = 0.5. The model was trained using the adaptive moment estimation (Adam) optimizer, a popular and effective optimization algorithm widely used in training neural networks. This configuration consistently outperformed others across cross-validation folds.
Stratified 5-fold cross-validation was used to assess the model’s generalization performance. The results demonstrated strong and stable classification capability, with an average accuracy of 0.8449 and an average area under the curve (AUC)-receiver operating characteristic (ROC) of 0.9546. Individual fold metrics are listed below:
Fold 1—accuracy: 0.8146, AUC-ROC: 0.9637
Fold 2—accuracy: 0.7947, AUC-ROC: 0.9170
Fold 3—accuracy: 0.8477, AUC-ROC: 0.9690
Fold 4—accuracy: 0.8675, AUC-ROC: 0.9494
Fold 5—accuracy: 0.9000, AUC-ROC: 0.9739
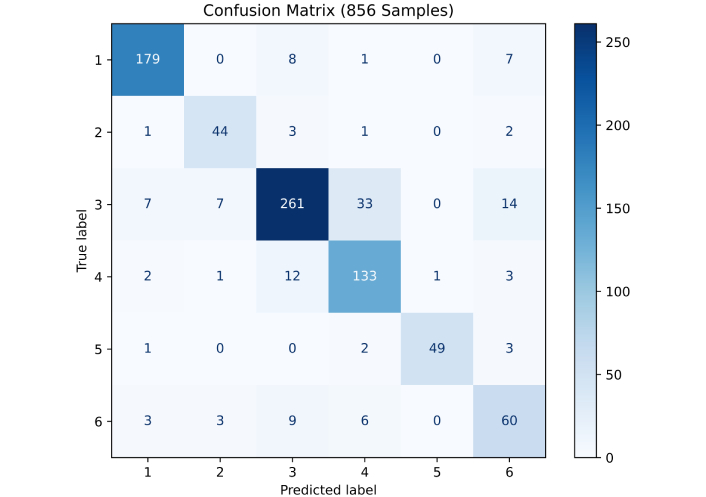
In addition, a confusion matrix summarizing the model’s classification results across all folds is presented in Figure 3.
It provides further insight into the distribution of correct and incorrect predictions among the diagnostic categories.
These results confirm the model’s robustness and its ability to reliably distinguish between diagnostic categories. This is further supported by the ROC curves obtained for each fold (Figure 4).
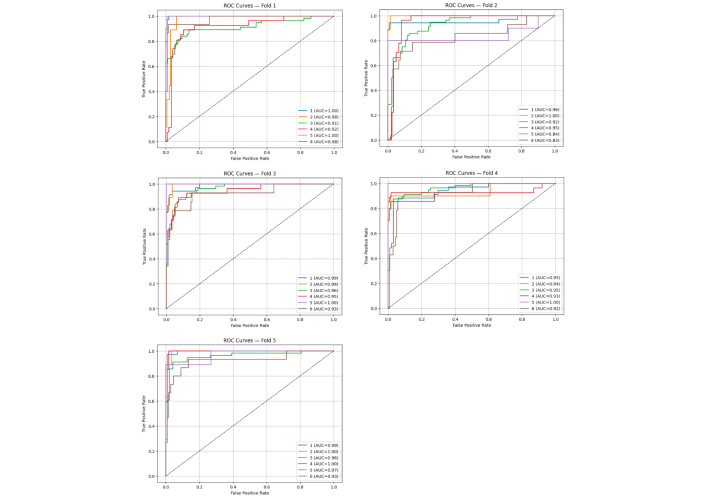
Receiver operating characteristic (ROC)-area under the curve (AUC) curves illustrating the model’s discriminative power for each fold in cross-validation
AOA indicator, determined using the potentiometric method, can be considered as a convenient laboratory test, combining the tools of analytical electrochemistry with clinical, medical approaches to the assessment of OS in various diseases. The wide possibilities offered by electrochemistry for the creation of numerous sensors (multi-sensors), allowing simultaneous measurement of various substances in a biological sample, are in this case an additional advantage. New directions in biosensor development for determining AOA may include the use of multi-enzymatic systems, stable and smaller immobilization platforms, the application of chemometric methods in evaluating experimental data, and the development of disposable biosensors [21].
Some unresolved issues remain, such as clarification of the influence of factors traditionally associated with the development of OS or affecting its severity—obesity, smoking, gender differences, age, as well as experimental conditions (the influence of temperature on the AO properties of the biologic sample) on the AOA index. Earlier in our work [22], we have demonstrated the presence of stable correlation between the results of AOA analysis obtained at t = 25°C and t = 37°C both by potentiometry (at both temperatures) and in Total Antioxidant Status (Randox TAS) Assay measurements at t = 37°C. It allows, on the one hand, to draw a conclusion about different bioavailability of the groups determining AOA of plasma at different temperatures, on the other hand, to consciously use the results of measurements carried out at room temperature, and thus to simplify, if necessary, the analysis procedure and the apparatus used for this purpose. Since the question of the influence of temperature on the bioavailability of different groups of AOA remains not completely clear (it is not well studied, what groups change their bioavailability—perhaps this is due to the different availability of sulfhydryl groups in proteins at different temperatures, this is not yet known; how linear these changes are, what additional factors may influence it), we have carried out our measurements at both temperatures.
Although in the initial work it was demonstrated [22] that the range of blood plasma AOA values and trends in their variation in groups of patients selected by gender and age were close to the data indicated in the literature, no reliable differences were obtained, as well as in our subsequent work [25]. Perhaps, a special study with a large (thousands) number of patients, taking into account the main associated factors (weight and height, menstrual cycle phase, ethnicity, national and territorial peculiarities of dietary intake) will bring additional clarity to this issue.
Probably, with the classical traditional approach to evaluating indicators characterizing various parameters of AO defense system and AOA, due to the reasons discussed above (wide variability in the values of AO and Ox parameters, as well as their numerous, non-linear interactions), there is a high probability of losing important information due to the fact that existing statistical methods cannot assess all aspects of interaction in the system between Oxs and AOs. Solving the problem of identifying hidden complex non-linear dependencies is facilitated by the application of artificial neural networks. Unlike correlation analysis, which only assesses linear relationships between variables, artificial neural networks can model complex non-linear relationships between variables, including quadratic, cubic, and other non-linear functions that may be invisible to correlation analysis. They can analyze the interaction between different features and consider their influence on the output, allowing them to detect complex dependencies that may be due to the interaction of a large number of parameters. Neural networks are capable of autonomously extracting significant features from data during the ML process. They can identify hidden patterns and regularities that may be difficult to detect using classical statistical methods [55, 56].
Of course, this approach has its drawbacks, which should be considered when using this methodology. Effective training of a neural network requires a sufficiently large amount of data. Insufficient data may lead to overfitting or underfitting of the model, which in turn may result in a deterioration of the model’s generalization ability on new data. Neural networks are typically “black boxes”, making it difficult to understand which functions or features they specifically use to make decisions. This complicates the interpretation of results and the explanation of decisions made by the model. Additionally, artificial neural networks are quite resource-intensive. To achieve good recognition performance during training, significant computational resources are required, including powerful processors and graphics accelerators. Neural networks may be sensitive to noise in data, leading to distorted results and degraded prediction quality. Selecting optimal model hyperparameters (such as the number of layers, number of neurons per layer, learning rate, etc.) can be a challenging task requiring experimentation and expertise. However, these challenges arise during the model training stage, and with a well-designed numerical experiment, quite good results can be achieved. Furthermore, deploying the model does not require such significant resources.
This may be of practical interest, for example, in screening large populations with cardiovascular risk factors (HT, hypercholesterolemia, smoking, obesity, etc.). Additional assessment of OS (AOA parameter) together with a set of routine tests allows the identification of patients with high risk of coronary heart disease and cerebrovascular disease among the group of people with HT, using AI instead of labor-intensive, expensive, and often unsafe (including invasive) diagnostic methods. However, we are confident that with further optimization and development of analysis methods (improvement of potentiometry methodology, use of electrodes with improved characteristics based on new materials, use of large computing power, training of neural networks), even more attractive results can be achieved. The results obtained may be of significant importance for the development of AI-based methods for the diagnosis and treatment of CVDs, as well as for more accurate risk identification and personalized diagnostic and therapeutic approaches to patients.
Improving recognition accuracy involves strategies such as increasing neural network depth, leveraging DL models, incorporating diverse ML techniques, and forming model ensembles. Ensembles, in particular, are effective as they amalgamate predictions from various models, enhancing generalization and accuracy while mitigating overfitting risks. Their strength lies in capturing diverse data facets and ironing out individual model errors, leading to more precise predictions. Ensembles exhibit resilience to data variability and noise, thus enhancing prediction stability by minimizing random influences. Moreover, they excel in anomaly detection, aiding in the identification of irregular data patterns, valuable for diagnosing uncommon diseases or conditions. Additionally, as highlighted by Gao and Bao [57], ML algorithms serve in material simulation and identification, enabling the creation of a catalog of catalytically active materials with superior performance and aiding in concentration calculations.
Although further studies are needed in this area, the data obtained give us confidence that this approach—the use of neural networks to determine the optimal combination of parameters to be analyzed along with AOA, and the use of electrochemical methods and sensors to analyze the integral indices of redox balance (AOA), as well as individual AOs, AO defense system enzymes and Oxs—seems to be the most promising for studying the parameters of OS in different diseases and can help to create “laboratory signatures” for individual diseases screening in the future.
The application of ML algorithms for analyzing laboratory markers—AOA, glucose, uric acid, hemoglobin, and total cholesterol to a cohort of hypertensive patients appears promising for identifying those with comorbidities. This approach could potentially reduce costs, reduce the burden on clinic staff, minimize unnecessary and invasive procedures, and enhance both efficiency and timely diagnosis.
More of all, such electrochemical sensors may be employed as a point-of-care or wearable device in advanced large-scale systems for diagnosis and health monitoring purposes. ML and chemometrics can be implemented in the electrochemical sensors to achieve chemical sustainability, performance improvement, and acceleration of complex system applications [58]. Moreover, in the future, wearable devices will be able to integrate two different types of sensors to simultaneously detect traditional (chemical) and digital [47] (such as ECG, heart rate variability, temperature, breathing frequency, etc.) biomarkers.
A separate prospect is the application of AI for the creation of multi-sensors (optimal selection of a set of studied indicators), as well as for the evaluation of a simultaneously obtained array of indicators. The level of integration between biosensors and intelligent wearables is not high, and further study is still needed to determine how to combine biosensing technology with intelligent wearables. It is expected that multi-functional and stable wearable biosensors can be prepared to provide health protection for people’s daily lives in the future [59].
Nevertheless, the use of AI in medicine is not without a number of disadvantages, such as:
“Black-box” problem: “black-box” nature of ML algorithms, in particular neural networks, can be difficult to interpret [48, 60].
The results of neural network analysis and neural network training depend on the initial data provided, i.e. the properties of the sample. Data generated is often isolated and difficult to integrate from both perspectives of data ownership and fusion algorithms [39].
AI’s impact on data privacy and ethical concerns. Data privacy and security are crucial [40]. Patients also exhibit a lack of trust in AI applications, and there are insufficient regulations to protect patients’ privacy and rights.
The lack of algorithmic integration is only one problem that needs to be addressed. Even more important are the biases and lack of generalizability that have been documented by many investigators [61].
Underdeveloped fairness, safety, and accountability of AI use in medicine [39].
Impact of poor quality data on analysis results and difficulty in quality control.
In this work, a neural network was created to study the non-linear relationships between OS indicators and various clinical and laboratory parameters in different nosological forms of CVDs. The obtained encouraging data already now allow to use the developed algorithm in practice, particularly, to potentially improve the results of screening for CVDs in large groups of patients when examining organized teams, for example, employees of enterprises with harmful and difficult working conditions, working in adverse climatic conditions (beyond the Arctic Circle), in hard-to-reach and remote areas. Creating a relatively large sample of such patients and processing their clinical and laboratory data using the existing algorithm will potentially help to more accurately identify patients with cardiovascular risk, and justifiably provide them with timely, simple recommendations for disease prevention, as well as create a roadmap for further necessary examinations. Expanding the sample size based on existing data, reanalyzing previously excluded information, and validating the findings with a larger patient cohort could help confirm our hypothesis and reveal additional patterns and correlations. It is necessary to confirm the hypothesis by comparison of data using different ML algorithms, on large groups of patients with different verified pathologies.
The limitations of this study include potential inaccuracies stemming from omitted data that may significantly affect AОA values. A notable concern is the unknown baseline AОA status of patients, as current AОA levels may be influenced by disease severity, medication, individual peculiarities of metabolism in the liver microsomal oxidation system, etc. Additionally, the possibility of excessive AO production (so-called “AO stress”), which is not well understood and studied, may impact the overall AОA measurement.
A practical solution may be the prescription of approved AO therapy for patients with CVDs based on data provided by AI. Additional randomized clinical trials are necessary for this approach to be established in practical medicine. There should be a comparison of placebo-controlled use of AOs for treating patients with suspected OS. Evidence of improvement with targeted treatment will serve as an additional factor confirming the correct functioning of AI algorithms. There is also a downside to this challenge—possibly employing new mathematical approaches could provide compelling evidence of the effectiveness of AO therapy for various diseases, as many clinical studies in this area have failed due to methodological shortcomings that seem insurmountable.
Implementing the discussed approach could streamline the screening process for patients with CVDs risk factors, enabling the efficient identification of those with specific cardiovascular conditions. This may significantly reduce diagnostic costs and shorten the time to initiate appropriate treatment.
The search for relationships between the mutual influence of AOA and laboratory tests is a potentially important and promising task lying in the search for new biomarkers of disease, and is one of the challenges defined by the results obtained and outlining the prospect of future work.
The ability to analyze non-linear relationships among laboratory indicators, including AОA, presents promising opportunities for creating portable and bedside screening devices. Utilizing electrochemical methods to assess AОA and other biochemical indicators paves the way for developing electrochemical sensors. Creating a multi-sensor platform based on AI-selected indicators for point-of-care diagnostics holds great potential for personalized medicine, especially in the context of individual, wireless wearable sensors.
Identifying the diagnostic value of AO status (AОA) in various disease groups, particularly cancer, poses a significant challenge. Our previous findings indicated a marked decrease in AОA levels among cancer patients, highlighting the need to employ ML algorithms to examine correlations with other clinical and laboratory tests. This strategy may improve early cancer detection and enhance the reliability of screening methods.
The use of AI methods (multilayer neural networks) can improve the diagnostic value of the AOA indicator in the screening of patients with CVDs. In the studied sample, the use of multilayer neural networks made it possible to determine, on the basis of laboratory parameters, including combination of AOA indicator with other biomarkers (glucose, cholesterol, uric acid, hemoglobin), the patient’s relation to a certain group of CVDs, including comorbid forms of HT (combined with chronic cerebral ischemia or coronary heart disease). An accuracy of determination was up to 85%.
The AOA indicator can be considered not only as an integral chemical value, but also as a quantitative indicator of health status. The data obtained using neural network analysis allows us to consider AOA as a biomarker of OS. The presence of latent interrelations between CVDs, laboratory parameters, and AOA index detected with the help of AI creates an objective need and opportunities for studying unknown pathogenetic interrelations between CVDs and OS, which will potentially help to reveal new mechanisms of diseases and create new approaches to their treatment, including through the correction of OS.
AI and the use of new methods of mathematical processing, along with or instead of traditional statistics, can provide completely unexpected, new, valuable information about the nature and properties of a complex phenomenon of OS, consisting of many interrelated patterns. These tools can enhance our ability to analyze and compute patterns of OS, potentially revealing unexpected insights. It is highly likely that optimal markers of OS can be identified using AI. The application of AI algorithms is a promising tool to improve the laboratory measurement of OS and a potential solution to overcome the contradictions in the existing approaches to the evaluation of OS in different diseases.
AI: artificial intelligence
AO: antioxidant
AOA: antioxidant activity
AUC: area under the curve
CVDs: cardiovascular diseases
HDL: high-density lipoproteins
HT: hypertension
LDL: low-density lipoproteins
ML: machine learning
MLP: multilayer perceptron
OS: oxidative stress
Oxs: oxidants
RNS: reactive nitrogen species
ROC: receiver operating characteristic
RONS: reactive oxygen and nitrogen species
ROS: reactive oxygen species
YK: Conceptualization, Supervision, Investigation, Formal analysis, Methodology, Writing—original draft, Writing—review & editing. AH: Conceptualization, Formal analysis, Methodology, Software, Writing—original draft. KhB: Conceptualization, Methodology. All authors read and approved the submitted version.
The authors declare that they have no conflicts of interest.
The study was conducted in accordance with the Declaration of Helsinki (2013) and the rules of Good Clinical Practice, and the protocol of the study was approved by the Local Ethics Committee of “Medical Technologies” JSC (project identification code 16-01-18 MT-AO, approval of the Ethics Committee № 5/2018).
Informed consent to participate in the study was obtained from all participants.
Not applicable.
The dataset analyzed for this study is included in the manuscript. Primary documentation is stored in the “Health 365” Clinic (“Medical Technologies” JSC, Yekaterinburg, Russia) database and is protected by the Personal Data Protection Act.
Not applicable.
© The Author(s) 2025.
Open Exploration maintains a neutral stance on jurisdictional claims in published institutional affiliations and maps. All opinions expressed in this article are the personal views of the author(s) and do not represent the stance of the editorial team or the publisher.
Copyright: © The Author(s) 2025. This is an Open Access article licensed under a Creative Commons Attribution 4.0 International License (https://creativecommons.org/licenses/by/4.0/), which permits unrestricted use, sharing, adaptation, distribution and reproduction in any medium or format, for any purpose, even commercially, as long as you give appropriate credit to the original author(s) and the source, provide a link to the Creative Commons license, and indicate if changes were made.