Original Article

Affiliation:
1Departement of Physiotherapy, School of Health Rehabilitation Sciences, University of Patra, 26504 Patra, Greece
2Department of Physiotherapy, Faculty of Health Sciences, Metropolitan College, 26221 Patra, Greece
3School of Health Sciences, Faculty of Environmental and Life Sciences, University of Southampton, SO17 1BJ Southampton, UK
Email: psakkatos@mitropolitiko.edu.gr
ORCID: https://orcid.org/0000-0001-5801-9765
Explor Digit Health Technol. 2025;3:101156 DOI: https://doi.org/10.37349/edht.2025.101156
Received: February 11, 2025 Accepted: May 08, 2025 Published: July 07, 2025
Academic Editor: Atanas G. Atanasov, Medical University of Vienna, Austria
Aim: Structured light plethysmography (SLP), is a contactless optical system developed to monitor breathing patterns by analyzing chest-wall movement. It has not been thoroughly validated against other non-invasive motion analysis systems under different breathing conditions. This study therefore aimed to evaluate the criterion-validity of the SLP compared to the respiratory inductive plethysmography (RIP) at rest and after exercise.
Methods: Adults underwent two simultaneous 5-minute recordings from both devices, conducted at rest and following submaximal exercise on a cycle ergometer. Timing indices and thoracoabdominal (TA) movement parameters were examined. Measurement agreement between SLP and RIP was assessed using Bland-Altman plots at rest, after exercise, and for exercise-induced changes.
Results: Fifty adults (mean age 29.3 ± 6.8 years; 30 males) participated. Α total of 3,395 and 4,295 breath cycles were analyzed at rest and post-exercise, respectively. Over 92% of differences in timing parameters under both conditions were within the 95% limits of agreement (LOA) and their mean differences were found close to zero across a wide range of breath cycle magnitudes (rest: 2.62–8.06 s; post-exercise: 2.16–6.16 s). For ΤΑ movement parameters, the mean bias between devices at rest was 0.31 for ribcage amplitude (RCampi) and 0.23 for abdominal amplitude (ABampi), with LOA ranging from −0.06 to 0.66 and −0.06 to 0.52, respectively. A trend towards greater discrepancies for the individual measurements of RCampi and ABampi at higher magnitudes of TA movements was noted, especially post-exercise. A good average agreement between the devices was found for RCampi/ABampi both at rest [mean difference: 0.03, standard deviation (SD): 0.21] and after exercise (mean difference: 1.10, SD: 0.24).
Conclusions: The SLP is an accurate method to quantify and measure timing indices and the ratio of the ribcage motion to the abdominal motion under different breathing conditions.
A breathing pattern comprises multiple variable components, including air volume, timing indices, and chest wall movement parameters, coordinated by the integrated function of physiological systems such as neural pathways, vital organs, and respiratory muscles [1]. Pathological alterations in breathing patterns, commonly referred to as dysfunctional breathing, are observed in several respiratory diseases and can serve as markers of disease control, particularly in conditions such as asthma [2, 3]. However, in clinical practice, objective measurement of changes in breathing pattern components remains challenging due to the lack of a monitoring system capable of simultaneously and instantaneously quantifying all key parameters. In clinical practice, the assessment of alterations in breathing patterns often relies on validated questionnaires due to their ease of use and practical applicability. Among the most frequently employed instruments are the Nijmegen Questionnaire, the Self-Evaluation of Breathing Questionnaire (SEBQ), and the manual assessment of respiratory motion (MARM), which primarily depend on patient perceptions and clinician experience [2]. However, these subjective measures lack the capacity to provide precise, quantifiable data on breathing patterns, thus limiting the ability to achieve a comprehensive and holistic respiratory assessment.
Over the years, non-invasive motion-analysis systems have been developed to objectively record thoracoabdominal (TA) movements and quantify breathing pattern components [4, 5]. The most widely used systems include the respiratory inductive plethysmograph (RIP), which measures chest wall motion using inductive coils embedded in two elastic bands, and the optoelectronic plethysmograph (OEP), which utilizes reflective markers placed on specific anatomical landmarks of the chest wall [6]. These systems have been extensively validated in both healthy and clinical populations under various breathing conditions [6].
Structured light plethysmography (SLP) has been a recently developed, portable, fully contactless digital motion-analysis system designed for clinical application. It enables real-time quantification of timing parameters and TA movement-related indices [7]. The system projects a structured black-and-white grid onto the anterior TA surface, spanning from the clavicles to the umbilicus, and captures respiratory-induced distortions of the grid using two auto-calibrated digital cameras [8]. These distortions are processed to generate a one-dimensional movement trace over time. For optimal image capture, subjects are required to wear a tight-fitting white T-shirt. Unlike RIP and OEP, SLP does not require direct contact or active cooperation from the subject, thereby minimizing the observer effect and allowing for objective measurement of natural breathing patterns and their variability over time [9].
SLP has been employed in clinical research to detect changes in breathing pattern components in patients with COVID-19 [10], chronic obstructive pulmonary disease (COPD) [11], neuromuscular disorders [12], and following lung surgery [13]. Its application has also been explored in pediatric populations across a range of respiratory conditions [14]. Notably, SLP has been shown to distinguish timing parameter differences between healthy children and children with asthma, both before and after bronchodilator administration [15]. Despite these promising findings, there remains limited evidence directly comparing SLP measurements to those obtained from reference-standard motion analysis systems under different breathing conditions. Existing validation studies have primarily focused on comparing SLP performance against pneumotachograph, evaluating timing indices at rest, and typically involving small samples of recorded breath cycles [8].
Therefore, the present study was an attempt to compare the measurement accuracy of SLP with another non-invasive motion analysis system, such as RIP. The validity of SLP was aimed to be assessed in different breathing conditions through a breath-by-breath analysis. It was hypothesized that SLP would provide accurate estimates of timing parameters and TA movement-associated indices both at rest and following exercise compared to RIP. Furthermore, it was hypothesized that SLP performance would be comparable to RIP in detecting changes in these parameters after exercise.
This observational cross-sectional study aimed to test the criterion validity of the SLP system by simultaneously obtaining specific breathing pattern components with the RIP at rest and immediately following submaximal exercise on a cycle ergometer. Breathing pattern components were recorded twice, each for a duration of five minutes, in a seated position within a single recording session.
Adult volunteers with varying body mass index (BMI) who provided written informed consent and were able to complete a 10-minute incremental exercise on a cycle ergometer were eligible for participation in the current study. Exercise was used to increase metabolic demand and elevate respiratory rate (RR) in order to check the agreement between the devices under different breathing conditions. Both healthy individuals and those self-reporting a history of respiratory disease were eligible, as the study focused on evaluating the measurement accuracy of SLP relative to RIP, irrespective of underlying respiratory status.
Participants presenting with acute respiratory symptoms, such as coughing, on the day of data collection were excluded to ensure the integrity of data acquired by the devices. Coughing during recording could introduce noise artifacts into the captured signals, compromising data quality. A convenience sample of 50 participants was recruited, aligning with sample sizes reported in previous RIP validation studies [16]. This sampling approach was selected due to the absence of established normative thresholds for expected differences between the two measurement methods across the evaluated breathing parameters.
Demographic data including participants’ age, gender, weight, and height were collected to summarize and characterize the study sample. Lung function was assessed prior to the measurements of the examined breathing pattern components using a portable spirometer (Vitalograph Model 6000 Alpha Spirometer, Vitalograph Ltd) in accordance with the guidelines for implementing optimal spirometry [17]. This was done both to characterize the participants’ baseline pulmonary function and to identify any subgroups with reduced lung function, in which comparisons between the devices could be conducted.
A cycle ergometer (Lode Corival V2, Lode B.V.) was used to administer an incremental exercise protocol aimed at increasing RR. The exercise protocol adhered to the American Thoracic Society/American College of Chest Physicians (ATS/ACCP) guidelines for exercise testing [18]. The total exercise duration was 10 minutes, beginning with a 3-minute warm-up phase at an intensity of 30 watts. Pedaling frequency was maintained between 80–90 revolutions per minute (rpm), and participants were verbally encouraged to sustain this cadence throughout the entire protocol. Following the warm-up, exercise intensity was increased by 25 watts every two minutes until the end of the test.
Breathing patterns were recorded for 5 minutes both at rest and immediately following exercise. It was not feasible to record breathing during exercise, as the SLP requires individuals to remain still and quiet during data acquisition. Specific breathing pattern components were examined in this criterion-validity study, such as timing indices and the amplitudes of ribcage and abdominal displacement of TA. These breathing parameters were selected because they are some of the key indicators of breathing patterns [19] and, following this validation study, have been evaluated as markers for the control of obstructive diseases such as asthma [20]. In particular, the breathing parameters analyzed included: RR, expressed as the number of breath cycles per minute [breaths per minute (bpm)]; inspiratory time (Ti) and expiratory time (Te), measured in seconds and defined as the durations of TA expansion and relaxation during the inspiratory and expiratory phases, respectively; the ratio of Ti to total breath cycle duration (Ti/Ttot), where Ttot is the sum of Ti and Te.
In addition, other breathing parameters examined included TA amplitudes during inspiration, specifically ribcage amplitude (RCampi) and abdominal amplitude (ABampi), expressed in arbitrary units. Typically, validation studies of the RIP assess the relative contributions of RCampi and ABampi to total chest wall movement, expressed as a percentage of their magnitudes during the respiratory phases [16, 21]. However, due to the absence of a validated weighting factor linking TA motion to air volume in SLP recordings at the time of conducting the present study, it was not appropriate to calculate the percentage of regional contributions to total TA movement. Therefore, direct comparisons between raw data of the two devices were made to estimate values of RCampi and ABampi, as well as their ratio (RCampi/ABampi). RCampi were defined as the vertical distance between a trough and the subsequent peak on the respiratory waveform generated from the ribcage signal of the devices. The ABampi were defined as the vertical distance between a trough and a peak on the respiratory waveform generated from the abdominal signal of the devices.
Each device provided separate output channels for the RCampi and ABampi waveforms, as well as a composite waveform representing the sum of both signals, from which RR was derived. The ribcage signal from the RIP system (Inductotrace, Ambulatory Monitoring Inc.) was obtained using insulated sinusoidal wire coils embedded within a wide elastic band positioned around the thorax at the level of the 4th to 6th ribs, just below the axillae. The RIP’s abdominal signal was produced by the motion of a circumferential area of abdomen through a second elastic band at the height of umbilicus. This configuration allowed measurement of the circumferential displacement of TA area via the use of the RIP.
The ribcage signal derived from the SLP system (Thora-3Di™, Pneumacare Ltd) was generated based on the distortion of a projected grid pattern caused by displacement of the anterior surface of the TA region, spanning from the level of the clavicles to the inferior margin of the xiphoid process. Grid size was selected based on each participant’s chest wall diameter, estimated using a tape measure, with three available configurations: 14 × 10 squares, 12 × 8 squares, and 10 × 6 squares [22]. The abdominal signal from the SLP was similarly generated by distortion of the grid pattern projected over the anterior abdominal surface, from the xiphoid process to the level of the umbilicus.
Both devices simultaneously recorded the breathing parameters, first at rest and then immediately following exercise, with participants seated on a straight, high-back chair with armrests. To enable subsequent synchronization of the two signals, participants were instructed to take a deep breath and hold it for five seconds at the beginning of each recording session, both at rest and post-exercise. Signal alignment was performed using this marker prior to the extraction of breathing parameters.
All the signals obtained by both devices for each recording period were visually assessed for quality prior to data extraction. When the RIP and the SLP signals were deemed to have baseline shifts or noise artifacts during the recording period due to body movements, ill-fitting of the RIP’s bands, or the SLP’s white T-shirt, they were discarded. The recording process was repeated until good quality signals were achieved. The RIP’s signals were transferred to a personal laptop via a data acquisition box, using a sample frequency of 30 Hz, which was equal to the fixed-sampling frequency of the SLP. A custom-built analog to digital converter was used to convert the RIP’s signal into a digital form on the laptop, where it was saved. The SLP digital time trace was illustrated on its computer screen and once breathing pattern data were collected, raw data were exported into comma-separated value (CSV) files and transferred to the same laptop with the uncalibrated RIP data for extraction and analysis.
The corresponding signals from each device were further aligned. Given the similarity in the morphology of the two summed-output signals, the tip of the first peak of a breath cycle in the SLP signal corresponding to that in the RIP signal was manually identified. The alignment procedure for each dataset was repeated three times, with visual inspection conducted after each attempt to ensure consistency between the aligned RIP and SLP signals.
Parameterized data [mean value (μ); standard deviation (SD)] of each breathing parameter were extracted from the time series data using a previously validated algorithm in MATLAB software (The MathWorks Inc, R2017b) [23]. This automatic detection algorithm was used to identify local minima and maxima for each inspiration phase of each detected breath cycle throughout the aligned signals. Each pair of the RIP and the SLP signals included the same number of breath cycles for all participants.
Statistical analyses were conducted using SPSS (IBM SPSS Statistics, Version 22). The analysis comprised: (a) evaluation of the agreement between averaged measurements at rest and post-exercise; (b) breath-by-breath agreement across all paired measurements from rest to post-exercise; and (c) assessment of the agreement in changes of parameters following exercise.
Normality of the differences between devices for each breathing pattern component was assessed using histograms and the Shapiro-Wilk test. Distributions were approximately normal for all parameters, except for RR, Te, and inspiratory-to-total time ratio (Ti/Ttot) at rest, and RR and RCampi after exercise. Nevertheless, given the absence of substantial skewness, the visual similarity of the distributions, and based on the central limit theorem, normality was assumed for these parameters [24].
Agreement between SLP and RIP was evaluated using Bland-Altman analysis. In each Bland-Altman plot provided in the following section, the differences for each examined breathing pattern component between the devices have been plotted on the Y-axis against the μ of them as measured by the reference method (RIP) as suggested by Krouwer [25].
Fifty adults (30 males) with mean age (SD) of 29.26 years old (6.79) participated in the study. Although 7 out of 50 participants self-reported history of asthma, no fixed airway obstruction was identified among the studied sample. The demographic data of study’s sample are presented in Table 1. All the participants successfully completed the 10-minute incremental exercise protocol. At rest, 3,395 and after exercise 4,295 breath cycles were identified and analyzed. A statistically significant change in RR was detected from both devices after exercise [RIP: μ –3.57 bpm, SD 2.96 bpm, 95% confidence interval (CI) –4.41 to –2.73, p < 0.05; SLP: μ –3.57 bpm, SD 2.95 bpm, 95% CI –4.41 to –2.73, p < 0.5].
The demographic data and the lung function measurements of the study’s sample
| Variable | μ (SD) | 95% CI (lower, upper) |
|---|---|---|
| Age (years) | 29.26 (6.79) | 27.33, 31.19 |
| Height (cm) | 1.73 (0.11) | 1.70, 1.76 |
| Weight (kg) | 71.32 (16.25) | 66.70, 75.94 |
| BMI (kg/m2) | 23.83 (3.02) | 22.58, 24.30 |
| FEV1 (L) | 4.83 (1.23) | 4.48, 5.18 |
| FEV1predicted (L) | 3.78 (0.81) | 3.55, 4.01 |
| FVC (L) | 5.55 (1.31) | 5.17, 5.92 |
| FVCpredicted (L) | 4.47 (1.03) | 4.18, 4.76 |
| FEV1/FVC (%) | 87.03 (6.00) | 83.70, 87.11 |
| FEV1/FVCpredicted (%) | 84.56 (1.34) | 82.16, 82.92 |
95% CI: 95% confidence interval; BMI: body mass index; FEV1: forced expiratory volume in 1 second; FVC: forced vital capacity; SD: standard deviation; μ: mean value
Significant differences in timing parameters between the monitoring methods were not found both at rest and after exercise with the largest mean difference being found for Te at rest (Table 2). Averaged agreement between the methods for all timing parameters (RR, Ti/Ttot, and Te) was found both at rest and after exercise (Figures 1, 2, and 3 respectively). The majority of the differences (> 92%) for all timing parameters fell within 95% limits of agreement (LOA) and were close to zero over different magnitudes of breath cycles (Figures 1, 2, and 3). Similar results were found regarding breath-by-breath agreement and the measurement agreement for the changes in timing parameters after exercise (Tables 2 and 3, and Figures 1, 2, and 3).
Mean differences between the comparable methods at rest, after exercise, and for breath-by-breath analysis
| Variable | At rest | After exercise | Breath-by-breath analysis | |||
|---|---|---|---|---|---|---|
| μ (SD) | 95% LOA (lower, upper) | μ (SD) | 95% LOA (lower, upper) | μ (SD) | 95% LOA (lower, upper) | |
| RR (bpm) | 0.01* (0.04) | –0.07, 0.09 | 0.01 (0.02) | –0.03, 0.05 | - | - |
| Te (s) | –0.03 (0.09) | –0.21, 0.15 | 0.01 (0.04) | –0.07, 0.09 | 0.00 (0.30) | –0.58, 0.58 |
| Ti/Ttot | 0.00 (0.02) | –0.37, 0.37 | 0.00 (0.01) | –0.02, 0.02 | 0.00 (0.04) | –0.08, 0.08 |
| Rcampi (arbitrary units)** | 0.31 (0.18) | –0.06, 0.66 | 0.44 (0.29) | –0.13, 1.01 | 0.43 (0.31) | –0.19, 1.05 |
| ABampi (arbitrary units)** | 0.23 (0.15) | –0.06, 0.52 | 0.29 (0.20) | –0.10, 0.68 | 0.28 (0.21) | –0.13, 0.69 |
| RCampi/ABampi | 0.03 (0.21) | –0.33, 0.44 | 1.10 (0.24) | –0.38, 0.58 | 0.12 (0.69) | –1.23, 1.47 |
* In some cases, at the end of the aligned sum signal from either the SLP or RIP, a half or full breath cycle was identified. This occurred because the algorithm continued to detect respiratory activity until each device was manually stopped. As a result, the mean differences for this variable include decimal values. ** Arbitrary units were estimated due to a lack of a previously validated weighting factor for calibrating the SLP and due to the different recording approaches of the devices to measure chest wall displacement. -: no data. 95% LOA: 95% limits of agreement; ABampi: abdominal amplitude; bpm: breaths per minute; RCampi: ribcage amplitude; RIP: respiratory inductive plethysmography; RR: respiratory rate (expressed by bpm and the breath-by-breath analysis involved breath cycles during the whole recording period); SD: standard deviation; SLP: structured light plethysmography; Te: expiratory time; Ti: inspiratory time; Ttot: total breath cycle duration; μ: mean value
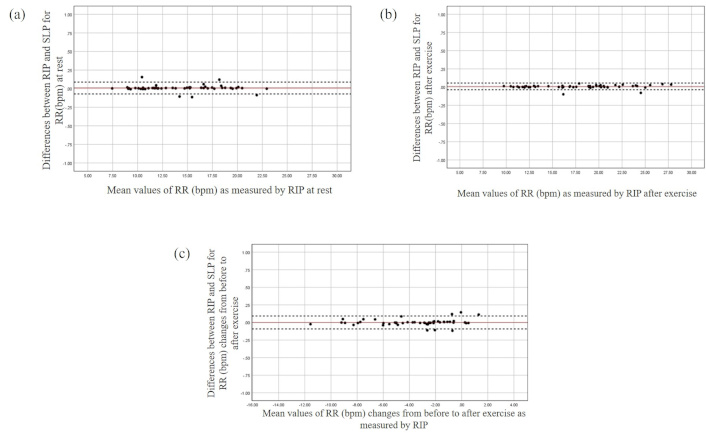
The Bland and Altman plots for the RR at rest (a), after exercise (b), and changes from before to after exercise (c). The X-axis represents the mean value of the parameter as measured by RIP, while the Y-axis depicts the differences between the devices. bpm: breaths per minute; RIP: respiratory inductive plethysmography; RR: respiratory rate; SLP: structured light plethysmography
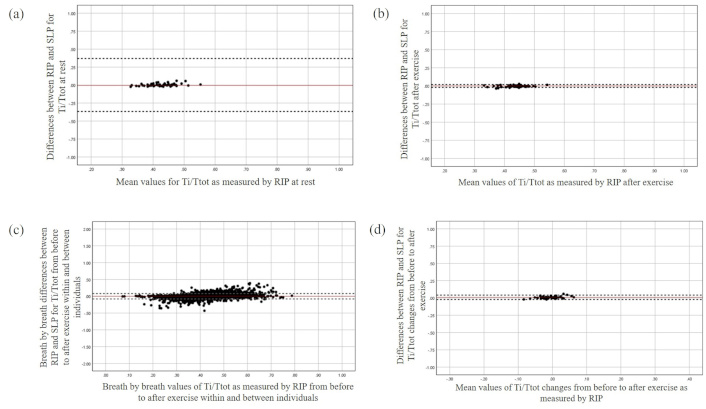
The Bland and Altman plot for Ti/Ttot at rest (a), after exercise (b), during breath-by-breath analysis (c), and the changes from before to after exercise (d). The X-axis represents the mean value of the parameter as measured by RIP, while the Y-axis depicts the differences between the devices. RIP: respiratory inductive plethysmography; SLP: structured light plethysmography; Ti: inspiratory time; Ttot: total breath cycle duration
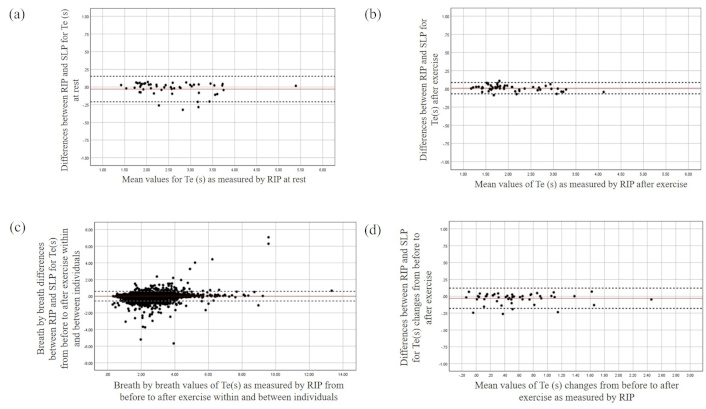
The Bland and Altman plots for the Te at rest (a), after exercise (b), during breath-by-breath analysis (c), and for the changes from before to after exercise (d). The X-axis represents the mean value of the parameter as measured by RIP, while the Y-axis depicts the differences between the devices. RIP: respiratory inductive plethysmography; SLP: structured light plethysmography; Te: expiratory time
Mean differences between the comparable methods for the changes in examined variables after exercise
| Variable | μ (SD) | 95% LOA (lower, upper) |
|---|---|---|
| RR (bpm) | 0.00 (0.05) | –0.09, 0.09 |
| Te (s) | –0.03 (0.07) | –0.18, 0.12 |
| Ti/Ttot | 0.01 (0.02) | –0.02, 0.04 |
| Rcampi (arbitrary units) | –0.14 (0.24) | –0.60, 0.32 |
| ABampi (arbitrary units) | –0.05 (0.16) | –0.37, 0.27 |
| RCampi/ABampi | –0.06 (0.21) | –0.50, 0.38 |
95% LOA: 95% limits of agreement; ABampi: abdominal amplitude; bpm: breaths per minute; RCampi: ribcage amplitude; SD: standard deviation; RR: respiratory rate (expressed by bpm and the breath-by-breath analysis involved breath cycles during the whole recording period); Te: expiratory time; Ti: inspiratory time; Ttot: total breath cycle duration; μ: mean value
The mean bias between the devices for RCampi and ABampi was found to be 0.31 and 0.23 at rest with the LOA ranging from –0.06 to 0.66 and –0.06 to 0.52 respectively. A potential tendency of greater discrepancies between the devices was found over greater magnitudes of these parameters at rest (Figure 4). This was consistent after exercise with both averaged and breath-by-breath measurement agreement being slightly violated at greater magnitudes of TA movements (Figure 4).
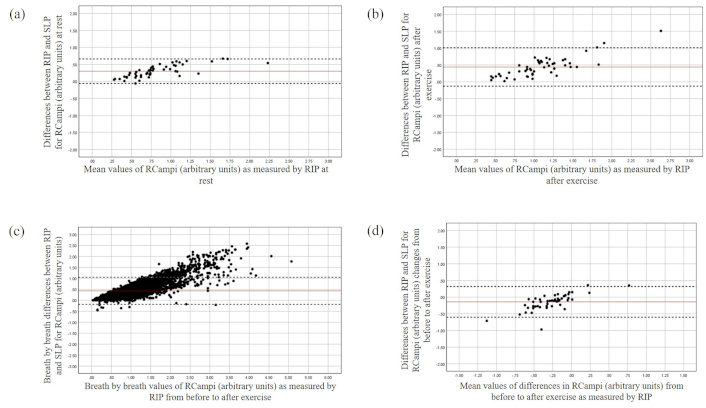
The Bland and Altman plot for the RCampi at rest (a), after exercise (b), during breath-by-breath analysis (c), and changes from before to after exercise (d). The X-axis represents the mean value of the parameter as measured by RIP, while the Y-axis depicts the differences between the devices. RCampi: ribcage amplitude; RIP: respiratory inductive plethysmography; SLP: structured light plethysmography
Both devices detected an averaged increase in RCampi (RIP: μ –0.26, SD 0.28, 95% CI –0.18 to 0.05; SLP: μ –0.13, SD 0.19, 95% CI –0.18 to 0.07) and ABampi after exercise. However, a systematic bias was found between the devices for the changes in the RCampi and ABampi (see Table 3) with SLP measuring smaller changes in displacements for both regions of TA area over greater magnitudes compared to the RIP (Figures 4 and 5). In contrast, good averaged and breath-by-breath agreement between the devices was found for RCampi/ABampi both at rest and after exercise (Tables 2 and 3; Figure 6).
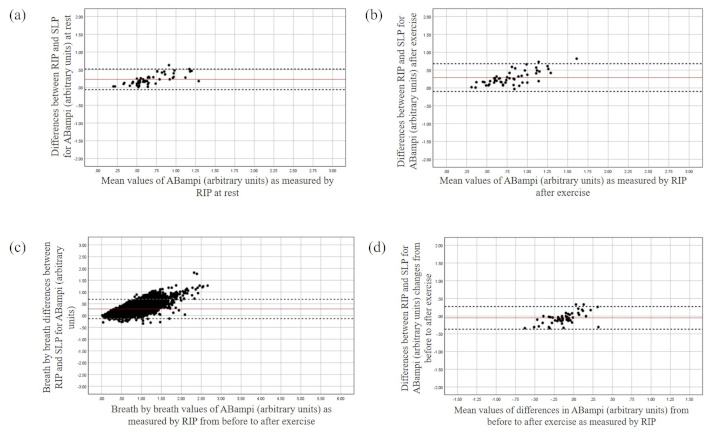
The Bland and Altman plot for the ABampi at rest (a), after exercise (b), during breath-by-breath analysis (c), and changes from before to after exercise (d). The X-axis represents the mean value of the parameter as measured by RIP, while the Y-axis depicts the differences between the devices. ABampi: abdominal amplitude; RIP: respiratory inductive plethysmography; SLP: structured light plethysmography
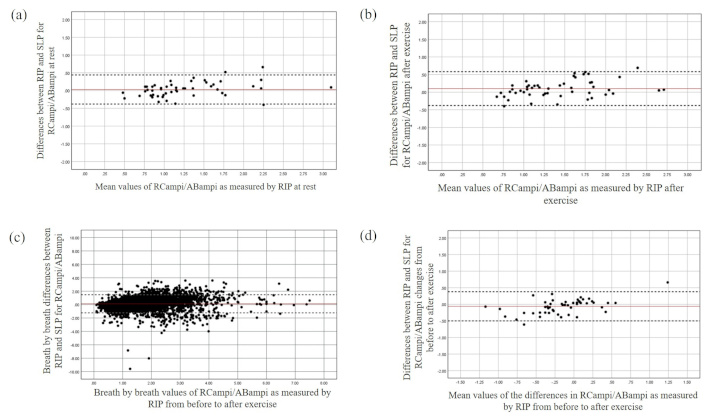
The Bland and Altman plot for the RCampi/ABampi at rest (a), after exercise (b), during breath-by-breath analysis (c), and changes from before to after exercise (d). The X-axis represents the mean value of the parameter as measured by RIP, while the Y-axis depicts the differences between the devices. ABampi: abdominal amplitude; RCampi: ribcage amplitude; RIP: respiratory inductive plethysmography; SLP: structured light plethysmography
The present study aimed to evaluate the criterion validity of SLP in comparison to RIP under resting and post-exercise conditions. The findings indicate that SLP can be regarded as a valid tool for monitoring and quantifying timing indices of breathing parameters at rest. These outcomes align with previously published studies demonstrating agreement between SLP and pneumotachograph in assessing timing-related respiratory variables [8]. However, prior evaluations of SLP accuracy were limited to resting conditions and relatively short recording durations (approximately 45 seconds). In contrast, the current study extends this evidence by confirming the sustained measurement accuracy of SLP over longer recording intervals.
This validation study contributes to the existing body of knowledge on the monitoring capabilities of SLP, demonstrating agreement in timing indices with RIP even during rapid breathing induced by submaximal exercise. The SLP was shown to accurately capture timing parameters across a broad range of breathing cycles, as determined through breath-by-breath analysis. The mean difference in RR measurements between RIP and SLP at rest and post-exercise was smaller than the clinically important difference of 2 bpm [26]. Although previous studies have suggested that SLP can detect differences in timing indices between healthy individuals and patients with COPD, indicating sensitivity to pathological changes, these findings were not previously validated against a reference-standard motion analysis system [13]. The current study confirms that SLP is capable of detecting alterations in timing indices of breathing patterns, with results closely matching those obtained using RIP.
Some contradictory results were found regarding the SLP’s ability to measure breathing parameters associated with TA movement compared to the RIP. The ability of the SLP to measure regional TA movements was previously supported in a small feasibility study (n = 15) where the SLP showed a statistically significant post-operative reduction in the RC contribution to TA movement after lung resection surgery [15]. In the present validation study, where direct comparisons of the RCampi and ABampi were made, both devices measured an average increase in RCampi after exercise confirming the SLP’s ability to detect changes in TA motion under a different breathing condition. Nevertheless, the SLP tends to identify smaller regional TA movements compared to the RIP. The difference was greater after exercise, when RCampi and ABampi were found to become larger. It was also noted that changes in the ratio of these breathing parameters measured by the RIP after exercise were almost double those estimated by the SLP.
These discrepancies could have been expected, since these devices use different recording approaches to quantify breathing kinematics. The RIP records changes in the cross-sectional (anteriorly, latterly, and posteriorly) regional compartments of the TA area [4, 6]. On the other hand, the SLP quantifies motion changes of a larger area of the surface of TA, between the clavicles and umbilicus, but only anteriorly [8, 19]. Studies characterizing breathing kinematics between resting and rapid breathing have shown that ribs tend to move upward, forward, and outward to increase the volume of chest wall during rapid breathing in a sitting position [27]. Since the SLP may not be able to detect fully circumferential changes in TA motion, this may result in the discrepancies found between the two methods of the current study.
To date, it is not clear whether the identified differences between the RIP and the SLP for the amplitudes of regional displacements of TA area can be considered clinically meaningful, due to a lack of normative standardized data. In theory, this may cause ambiguity in estimation of air-volume parameters by the SLP. Although this was beyond the scope of the current study, a growth-adjusted reference equations for tidal breathing parameters using SLP have been reported [28]. On the other hand, the SLP was found to be a valid tool to quantify objectively the ratio of the motion of the two compartments of TA area irrespective of the actual magnitude of the RC and AB displacements over a variety of breath sizes obtained at rest and after exercise.
As mentioned above, SLP is a fully contactless motion analysis system that has demonstrated validity and responsiveness in quantifying and recording both timing indices and TA movements, at rest and following exercise. This novel recording method requires minimal participant cooperation, and its non-contact nature theoretically reduces the likelihood of individuals becoming consciously aware of the breathing assessment—an issue commonly encountered with other non-invasive motion analysis systems such as RIP and OEP. It has been previously supported that SLP may minimize measurement-induced alterations in breathing patterns, thereby enabling a more accurate representation of an individual’s natural respiratory behavior [9]. Combined with its ease of use, these features support the potential of SLP as a valuable tool for the objective assessment of breathing patterns in clinical environments.
One of the limitations of the present study is that it examined the SLP’s accuracy in a relatively young healthy population with normal BMI, even though recruitment of a heterogeneous sample was attempted. This leaves open the SLP’s performance in other groups of people such as those with increased BMI or variable lung function. The study mainly focused on the examination of specific timing indices, RCampi, ABampi (expressed in arbitrary units), and thereby future validation studies could further evaluate the SLP’s performance for other physiological respiratory parameters such as air-volume components and breathing asynchronism by estimating the labored breathing index (LBI) as an indicator of breathing asynchronism in other populations in several positions. In the present study, breathing pattern components were recorded only in sitting position, partly because it is one of the common postures for evaluating breathing patterns in clinical practice.
As a result, future research should aim to expand our current knowledge regarding the SLP’s performance for quantifying a series of breathing pattern components in different postures compared to a standard reference motion analysis system. Finally, the reliability of the SLP was not specifically examined due to the primary interest of the current study design. However, previously published evidence has shown that SLP can provide reliable measurements of timing components during two consecutive resting breathing sessions as compared to a pneumotachograph [8]. Further work is needed to test its reliability regarding the measurements of TA movements over time.
ABampi: abdominal amplitude
BMI: body mass index
bpm: breaths per minute
CI: confidence interval
COPD: chronic obstructive pulmonary disease
LOA: limits of agreement
OEP: optoelectronic plethysmograph
RCampi: ribcage amplitude
RIP: respiratory inductive plethysmography
RR: respiratory rate
SD: standard deviation
SLP: structured light plethysmography
TA: thoracoabdominal
Te: expiratory time
Ti: inspiratory time
Ttot: total breath cycle duration
μ: mean value
The author thanks the funders for their financial support of this study which was part of a series of clinical studies conducted for the completion of the author’s doctoral degree. The author also thanks his supervision team (Prof. Anne Bruton and Prof. Anna Barney) during the conduction of the current study, who provided meticulous guidance for the design of the current study and the advice about the interpretation of the results of the current study. Finally, the author thanks Prof. Anna Barney for providing the written MATLAB algorithm used for data extraction in the present study.
PS: Conceptualization, Data curation, Formal analysis, Investigation, Methodology, Project administration, Software, Resources, Validation, Visualization, Writing—original draft, Writing—review & editing.
The author declares that he has no conflicts of interest.
The study was peer-reviewed and ethically approved by the Research Committee of the School of Health Sciences, Faculty of Environmental and Life Sciences, University of Southampton (ethic number: 18396). This study complies with the 2024 Declaration of Helsinki.
All participants provided a written consent form prior to their participation in the study.
Patients’ anonymous data were agreed to be published to maintain anonymity and protect individuals’ health data.
The datasets used and analyzed during the current study are available from the corresponding author (1st author of this manuscript) on reasonable request at psakkatos@mitropolitiko.edu.gr.
The current study was funded by the British Lung Foundation and the Wessex Medical Trust [15501/01]. The funders had no role in study design, data collection and analysis, decision to publish, or preparation of the manuscript.
© The Author(s) 2025.
Open Exploration maintains a neutral stance on jurisdictional claims in published institutional affiliations and maps. All opinions expressed in this article are the personal views of the author(s) and do not represent the stance of the editorial team or the publisher.
Copyright: © The Author(s) 2025. This is an Open Access article licensed under a Creative Commons Attribution 4.0 International License (https://creativecommons.org/licenses/by/4.0/), which permits unrestricted use, sharing, adaptation, distribution and reproduction in any medium or format, for any purpose, even commercially, as long as you give appropriate credit to the original author(s) and the source, provide a link to the Creative Commons license, and indicate if changes were made.