Review

Affiliation:
1Head and Neck Surgery Department and LIM, University of São Paulo Medical School (FMUSP), São Paulo 05403-010, Brazil
2Hospital Israelita Albert Einstein, São Paulo 05521-200, Brazil
Email: anna_luizaf5ph@hotmail.com
ORCID: https://orcid.org/0000-0002-3725-8051
Affiliation:
3Faculdade de Odontologia de Piracicaba, Universidade de Campinas (FOP-UNICAMP), Piracicaba 13414-903, São Paulo, Brazil
ORCID: https://orcid.org/0000-0002-7504-7597
Affiliation:
3Faculdade de Odontologia de Piracicaba, Universidade de Campinas (FOP-UNICAMP), Piracicaba 13414-903, São Paulo, Brazil
ORCID: https://orcid.org/0000-0003-1840-4911
Affiliation:
3Faculdade de Odontologia de Piracicaba, Universidade de Campinas (FOP-UNICAMP), Piracicaba 13414-903, São Paulo, Brazil
ORCID: https://orcid.org/0000-0001-6677-0065
Affiliation:
3Faculdade de Odontologia de Piracicaba, Universidade de Campinas (FOP-UNICAMP), Piracicaba 13414-903, São Paulo, Brazil
ORCID: https://orcid.org/0000-0003-2040-6617
Explor Digit Health Technol. 2025;3:101147 DOI: https://doi.org/10.37349/edht.2025.101147
Received: July 30, 2024 Accepted: April 07, 2025 Published: May 08, 2025
Academic Editor: Andy Wai Kan Yeung, The University of Hong Kong, China
The article belongs to the special issue Digital Health Technologies for the Early Detection of Oral Cancer
This narrative review aims to appraise the evidence on artificial intelligence models for early diagnosis and risk stratification of oral cancer, focusing on data modalities, methodology differences, applications in the diagnostic flow and models’ performance. Models for early diagnosis and screening provide non-invasive diagnosis without the need for specialized instruments, which is ideal for early detection as a low-cost system. Supervised learning with well-annotated data provides reliable references for training the models, and therefore, reliable and promising results. Risk prediction models can be built based on medical record data, demographic data, clinical/histopathological descriptors, highly standardized images or a combination of these. Insights on which patients have a greater chance of malignancy development or disease recurrence can aid in providing personalized care, which can improve the patient’s prognosis. Artificial intelligence models demonstrate promising results in early diagnosis and risk stratification of oral cancer.
The use of machine learning (ML) and deep learning (DL) models targeting oral squamous cell carcinoma (OSCC) diagnosis can be divided into diagnostic (detection and classification) and prognostic (risk stratification) models. Diagnostic models can be constructed based on a wide range of data inputs, either based on computer vision or natural language processing. In the field of computer vision for OSCC screening and early diagnosis, the types of clinical imaging data made available through clinical evaluation includes white light photographs either taken with professional cameras [1–17] or smartphones [18–27], and fluorescence images [26]. Risk stratification models target the identification of people at risk of developing cancer and models for predicting malignancy development either based on clinical/demographic/histopathological descriptors or highly standardized images [28–40].
Therefore, the diversity of proposals and architectures to address the complexity of these tasks highlights the need for personalized methodologies, as each approach has specific strengths and limitations. This underscores the importance of a comprehensive and critical review when selecting techniques for different clinical applications, reinforcing the relevance of a literature review on the topic. This narrative review aims to summarize the published evidence regarding artificial intelligence (AI) models for improved oral cancer detection (early diagnosis) and risk stratification.
Overall, photography-based diagnostic models are constructed based on the data often acquired for documentation purposes and readily available (i.e., clinical photographs), which represents a standout of such simpler approaches for OSCC early detection. Image processing usually focuses on three main tasks: object detection, segmentation, and classification (Table 1).
Photography-based diagnostic models
| Author, year | Task; classes (n) | Feature extractors/Features extracted | Classifier | Accuracy | Specificity (TNR) | Sensitivity (recall) | Precision (PPV) | AUC | F1-score or Jaccard index |
|---|---|---|---|---|---|---|---|---|---|
| Camalan et al. [1], 2021 | Classification; suspicious (54) and normal (54) ROIs in photographic images | - | Inception ResNet-v2 | 86.5% | - | - | - | - | - |
| - | ResNet-101 | 79.3% | - | - | - | - | - | ||
| Figueroa et al. [2], 2022 | Classification; suspicious (i.e., OSCC and OPMD) (~ 2,800) and normal (~ 2,800) photographic images | - | GAIN network | 84.84% | 89.3% | 76.6% | - | - | - |
| Flügge et al. [3], 2023 | Classification; OSCC (703) and normal (703) photographic images | - | Swin-transformer DL network | 0.98 | 0.98 | 0.98 | - | - | 0.98 |
| Jubair et al. [4], 2022 | Classification; suspicious [i.e., OSCC and OPMD (236)] and benign (480) photographic images | - | EfficientNetB0 | 85% | 84.5% | - | - | 0.92 | - |
| Jurczyszyn et al. [5], 2020 | Classification; OSCC (35) and normal (35) photographic images (1 normal and one of leukoplakia in the same patient) | MaZda software/Textural features, as run length matrix (two), co-occurrence matrix (two), Haar Wavelet transformation (two) | Probabilistic neural network | - | 97% | 100% | - | - | - |
| Lim et al. [6], 2021 | Classification; no referral (493), refer—cancer/high-risk (636), refer—low-risk (685), and refer—other reasons (641) | - | ResNet-101 | - | - | 61.70% | 61.96% | - | 61.68% |
| Shamim et al. [7], 2019 | Classification; benign and precancerous (200) photographic images | - | VGG19 | 98% | 97% | 89% | - | - | - |
| AlexNet | 93% | 94% | 88% | - | - | - | |||
| GoogLeNet | 93% | 88% | 80% | - | - | - | |||
| ResNet50 | 90% | 96% | 84% | - | - | - | |||
| Inceptionv3 | 93% | 88% | 83% | - | - | - | |||
| SqueezeNet | 93% | 96% | 85% | - | - | - | |||
| Classification; types of tongue lesions (300) photographic images | - | VGG19 | 97% | - | - | - | - | - | |
| AlexNet | 83% | - | - | - | - | - | |||
| GoogLeNet | 88% | - | - | - | - | - | |||
| ResNet50 | 97% | - | - | - | - | - | |||
| Inceptionv3 | 92% | - | - | - | - | - | |||
| SqueezeNet | 90% | - | - | - | - | - | |||
| Sharma et al. [8], 2022 | Classification; OSCC (121), OPMD (102) and normal (106) photographic images | - | VGG19 | 76% | - | OSCC: 0.43 | OSCC: 0.76 | OSCC: 0.92 | OSCC: 0.45 |
| - | Normal: 1 | Normal: 0.9 | Normal: 0.99 | Normal: 0.95 | |||||
| - | OPMD: 0.78 | OPMD: 0.7 | OPMD: 0.88 | OPMD: 0.74 | |||||
| VGG16 | 72% | - | - | - | OSCC: 0.94 | - | |||
| - | - | - | Normal: 0.96 | - | |||||
| - | - | - | OPMD: 0.92 | - | |||||
| MobileNet | 72% | - | - | - | OSCC: 0.88 | - | |||
| - | - | - | Normal: 0.99 | - | |||||
| - | - | - | OPMD: 0.80 | - | |||||
| InceptionV3 | 68% | - | - | - | OSCC: 0.88 | - | |||
| - | - | - | Normal: 0.1 | - | |||||
| - | - | - | OPMD: 0.88 | - | |||||
| ResNet50 | 36% | - | - | - | OSCC: 0.43 | - | |||
| - | - | - | Normal: 0.33 | - | |||||
| - | - | - | OPMD: 0.42 | - | |||||
| Song et al. [9], 2021 | Classification; malignant (911), premalignant (1,100), benign (243) and normal (2,417) polarized white light photographic images | - | VGG19 | 80% | - | 79% | 83% | - | 81% |
| Song et al. [10], 2023 | Classification; suspicious (1,062), normal (978) photographic images | - | SE-ABN | 87.7% | 88.6% | 86.8% | 87.5% | - | - |
| SE-ABN + manually edited attention maps | 90.3% | 90.8% | 89.8% | 89.9% | - | - | |||
| Tanriver et al. [11], 2021 | Segmentation, object detection and classification; carcinoma (162), OPMD (248) and benign (274) photographic images | - | EfficientNet-b4 | - | - | 85.5% | 86.9% | - | 85.8% |
| Inception-v4 | - | - | 85.5% | 87.7% | - | 85.8% | |||
| DenseNet-161 | - | - | 84.1% | 87.9% | - | 84.4% | |||
| ResNet-152 | - | - | 81.2% | 82.6% | - | 81.1% | |||
| Ensemble | - | - | 84.1% | 84.9% | - | 84.3% | |||
| Thomas et al. [12], 2013 | Classification; 192 sections of photographic images from 16 patients | GLCM, GLRL and intensity based first order features (eleven selected features) | Backpropagation based ANN | 97.92% | - | - | - | - | - |
| Warin et al. [13], 2021 | Object detection and classification; OPMD (350) and normal (350) photographic images | - | DenseNet-121 | - | 100% | 98.75% | 99% | 0.99 | 99% |
| Warin et al. [14], 2022 | Object detection and classification; OPMD (315) and OSCC (365) photographic images | - | DenseNet-169 | - | OSCC: 99% | OSCC: 99% | OSCC: 98% | OSCC: 1 | OSCC: 98% |
| - | OPMD: 97% | OPMD: 95% | OPMD: 95% | OPMD: 0.98 | OPMD: 95% | ||||
| ResNet-101 | - | OSCC: 94% | OSCC: 92% | OSCC: 96% | OSCC: 0.99 | OSCC: 94% | |||
| - | OPMD: 94% | OPMD: 97% | OPMD: 97% | OPMD: 0.97 | OPMD: 97% | ||||
| Warin et al. [15], 2022 | Object detection and classification; OPMD (300) and normal (300) photographic images | - | DenseNet-121 | - | 90% | 100% | 91% | 0.95 | 95% |
| ResNet-50 | - | 91.67% | 98.39% | 92% | 0.95 | 95% | |||
| Welikala et al. [16], 2020 | Object detection and classification; referral (1,054) and non-referral (379) photographic images | - | ResNet-101 | - | - | 93.88% | 67.15% | - | 78.30% |
| Xue et al. [17], 2022 | Classification; ruler (440) and non-ruler (2,377) photographic images; first batch (2,817 images/250 patients), second batch (4,331 images/168 patients) | - | ResNetSt | 99.6% | 99.6% | 100% | 97.9% | 99.6% | 98.9% |
| Vit | 99.8% | 99.8% | 100% | 0.98 | 99.8% | 99.5% |
ANN: artificial neural network; DL: deep learning; GAIN: guided attention inference; GLCM: gray-level co-occurrence matrix; GLRL: grey level run-length matrix; OPMD: oral potentially malignant disorders; OSCC: oral squamous cell carcinoma; PPV: positive predictive value; ROI: region of interest; TNR: true negative rate; AUC: area under the curv
Object detection is a computer vision technique that identifies and locates specific objects within images, using bounding boxes to mark their position (Figure 1A). According to the international literature on OSCC and oral potentially malignant disorders (OPMD), YOLO versions are commonly implemented for this task as reported by Tanriver et al. [11] and Warin et al. [14, 15], followed by Faster R-CNN [14, 15], among others [14, 18]. The performance of object detection models varies greatly across architectures and according to the diagnosis as reported by Warin et al. [14]. In this study, OPMDs had worse detection metrics [area under the curve (AUC) varying from 0.34 to 0.64] compared to OSCC (AUC varying from 0.81 to 0.91), which can be explained by the challenging recognition of OPMDs features, even by professionals. When comparing architectures, it seems that Faster R-CNN performs better than YOLO [14, 15]. However, these findings need more extensive assessment. Tanriver et al. [11] also implemented versions of YOLO but the results, varying from 0.57 to 0.64, are presented in average precision metrics, making conclusive comparisons difficult.
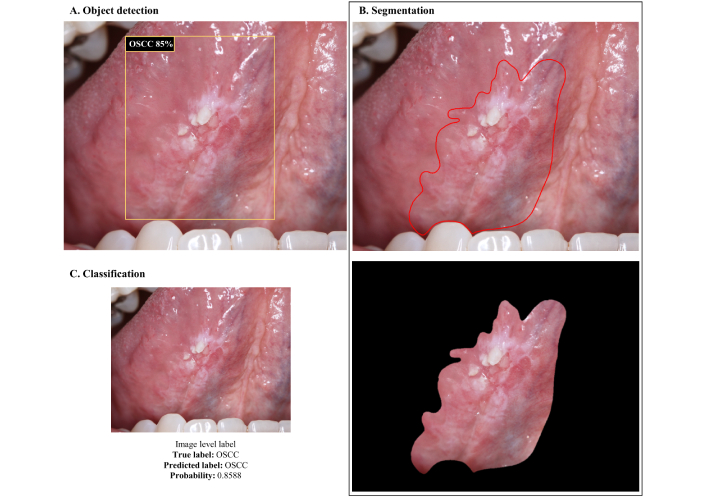
Visual representation of CNNs outputs based on the task. (A) Object detection; (B) segmentation; and (C) classification. OSCC: oral squamous cell carcinoma; CNNs: convolutional neural networks
Object detection can be a valuable strategy to incorporate into models aimed at referral decisions, as it allows the suspicious lesion to be identified in the photograph and further classified. The main objective of this type of model, however, is not to diagnose the lesion/disease, but rather to assess whether it is worrying enough to justify referring the patient to a specialist, considering this status as the model output. This approach simplifies the data annotation process, as it only requires the definition of bounding boxes and uses two or three broad classes that encompass different types of injuries, avoiding the need for individual diagnostic classes that could increase complexity of the model. In this sense, Lim et al. [6] proposed a mouth landmark detection and classification module to classify photographic images based on the referral decision (no referral, refer—cancer/high-risk, refer—low-risk, and refer—other reasons). The model reached a macro average precision of 61.96%, recall of 61.70%, and F1-score of 61.68%. Welikala et al. [16] also developed a screening algorithm for referral decision based on Faster R-CNN and ResNet-101, achieving 67.15% precision, 93.88% recall, and 78.30% F1-score for the “referral” vs. “non-referral” classification.
Segmentation techniques are applied to isolate the region of interest within the image (Figure 1B). In the context of the semantic segmentation task, Tanriver et al. [11] employed the U-Net architecture, achieving expressive results with a Dice index around 0.92, to distinguish the lesion from the background. Furthermore, the author used Mask R-CNN with a ResNet backbone for instance segmentation, which integrates the concepts of object detection and semantic segmentation, allowing the differentiation of each occurrence of an object belonging to the same class.
Image classification is a computer vision task that involves assigning a label or category to an entire image based on its visual content (Figure 1C). For the classification experiments, Tanriver et al. [11] implemented EfficientNet-b4, Inception-v4, DenseNet-161, ResNet-152, and an ensemble model using different input sizes, with all architectures performing closely, reaching performance metrics that varied from 0.81 to 0.87. Jubair et al. [4] compared three deep learning (DL) models (EfficientNetB0, VGG19, and ResNet101) with pre-trained weights to classify clinical photographs into suspicious (i.e., OSCC and OPMD) and benign lesions. EfficientNetB0 performed the best with 85% mean accuracy, 84.5% mean specificity, 86.7% mean sensitivity, and 0.911 (AUC). The similarity in performance between the different models can be attributed to several factors. These models may have similar capabilities in feature extraction and representation, which are crucial for image classification tasks. Furthermore, variations in input size may not have had a substantial impact on overall performance, suggesting that the models were robust at handling different image resolutions. This result also highlights the importance of model tuning, where the best configuration may result from a balance between model complexity and data characteristics [41].
For the multiclass image classification task, Warin et al. [14] implemented DenseNet-169, ResNet-101, SqueezeNet, and Swin-S. DenseNet-169 and ResNet-101 outperformed oral and maxillofacial surgeons’ and general practitioners’ performance with metrics varying from 0.94 to 0.99. This improvement in performance suggests that DL models may be more effective at detecting subtle patterns in medical images than human experts, particularly in complex image classification tasks such as distinguishing benign from malignant lesions in the oral cavity. One reason for this may be the ability of DL models to process large volumes of data and extract features that may not be immediately visible to the human eye. These models can identify intricate patterns in images that might otherwise be overlooked by clinicians, especially in detecting early-stage disease, where subtle differences in tissue can be crucial to diagnosis.
According to Liyanage et al. [21], EfficientNetV2 achieved an overall accuracy of 75%, while MobileNetV3 achieved 76% with recall, precision and F1-score around 61% to 64%, and AUC of 0.88 for both models in distinguishing non-neoplastic and OPMD lesions. Fu et al. [18] developed a DL algorithm for OSCC detection from photographic images, in which the DL model was trained with an extensive dataset of ordinary clinical photos, and further clinically validated using a different data set that included a subset of photographs of early-stage OSCC measuring less than two centimeters, reaching accuracy values that ranged from 91.5% to 95.3% and AUC values ranging from 0.93 to 0.99. This is an example of how the model surpasses its learning by generalizing well on a difficult task. Ideally, after training, these models should be tested on an independent dataset comprising patients not included in the initial development phase. This external validation is crucial for determining whether a model can generalize beyond its training data and perform reliably in diverse clinical settings. While our review summarizes the methodologies and findings of the included studies, we also highlight the need for future research to prioritize rigorous external validation to enhance the clinical applicability of AI-driven diagnostic models.
Swin Transformer is an advanced type of Transformer-based architecture designed for computer vision applications such as image classification, object detection, and segmentation. This architecture is more efficient as it processes images in smaller patches instead of processing all image tokens at the same time, hence being called “Swin”, which stands for Shifted Window. These architectures have a global context ability and hierarchical processing and are applied when high precision and computational efficiency are required, especially for medical imaging processing. In this sense, Flügge et al. [3] implemented a pre-trained Swin Transformer deep neural network for OSCC detection with performance metrics around 0.98 facilitated by hierarchical feature maps and shifted window attention. Xue et al. [17] compared two models, a ResNetSt and a ViT model (based on transformers and originally designed for natural language processing) to classify images into “ruler” (indicates there is a lesion in the image) and “non-ruler”, reaching almost perfect performance. Talwar et al. [25] proposed a DenseNet201 and Swin Transformer to classify white light images alone, providing a simpler interpretation. The authors considered this model to be of great value for frontline-health-workers, as the model is parameter efficient, only requires images captured by a smartphone, and reached 73% F1-score in identifying suspicious and non-suspicious lesions.
Approaches that integrate the analysis of textural features (low-order features), such as those described by Jurczyszyn et al. [5] and Thomas et al. [12], highlight that feature selection is a fundamental step in pre-processing for traditional ML methods. These approaches are not inferior to DL methods based on high-order features, but they are more laborious. Despite using different textural features to train their models, both studies achieved high performance metrics, ranging between 97% and 100%.
Data abundance is a consistent problem across studies. To address the lack of large datasets for training convolutional neural networks (CNNs), all studies applied either pre-training, transfer learning and/or data augmentation, which are effective strategies to address the small dataset problem [1–4, 6–11, 13–16]. Pre-training involves training a CNN on a general and substantially large dataset, with the goal of learning fundamental patterns in a robust and versatile way, while transfer learning leverages this knowledge in a smaller and specific data set, adapting (fine-tuning) the model to the new task. Data augmentation increases the dataset’s size and variability by creating artificial instances/images that will ultimately improve the model’s robustness, since it exposes CNN to a wider pattern variation. While studies applying traditional ML approaches reached good results using no more than 16 [12] to 35 patients [5], DL approaches require a great amount of data and were developed using datasets of variable sizes (from approximately 50 to 2,500 patients, sometimes with multiple images per patient) associated with different strategies to increase the number of inputs for training. Even when applying transfer learning, CNN performance varies greatly depending on the dataset, the architecture and the associated strategies. Sharma et al. [8] developed 5 models based on transfer learning (i.e., pretrained with ImageNet) to classify oral photographs into normal, OSCC or OPMD, achieving 76% accuracy with their best model. Meanwhile, González and Quintero-Rojas [19] developed an application based on a pretrained MobileNetV2 to classify normal cases, aphthous stomatitis, leukoplakia, herpes simplex virus type 1 (HSV1), and nicotinic stomatitis, reaching accuracies ranging from 88% to 95%, depending on the class. Camalan et al. [1] implemented two pretrained models to classify clinical photographs into “suspicious” or “normal” using two independent datasets from different countries for training and validation, with accuracies ranging from 66.7% to 86.5%, depending on the dataset arrangement, which is valuable to assess how population variations interfere in the model learning. To deal with the class imbalance problem, Jubair et al. [4] used the weighted cross entropy loss, which adjusts the contribution of each image to the training error, penalizing suspicious samples 2.5 times more than benign ones. Song et al. [9] and Figueroa et al. [2] applied oversampling, undersampling [9], and data augmentation [2], in combination with pre-training or transfer learning, both achieving accuracy metrics above 80%. Lin et al. [20] implemented a pretrained CNN to classify five categories (normal, aphthous ulcer, low-risk OPMD, high-risk OPMD, and cancer) by applying a resampling method to manage image variability and class imbalance. These data-level approaches increase dataset size while mitigating class imbalance, a critical issue that can affect performance and interpretation, as models may favor the majority class, limiting learning for minority classes. A distinguishing aspect of Song’s approach [9] is the use of polarized white light photographs, which eliminate surface reflections. The authors concluded that algorithm-level approaches alone are insufficient and recommended combining them with cross-entropy loss. According to Figueroa et al. [2], oversampling and data augmentation yielded better results than transfer learning combined with data augmentation alone.
Despite these promising results, each protocol presents limitations that can be addressed by integrating manual annotation and expert-guided adjustments to improve models’ performance. This strategy, incorporating human knowledge to improve CNN outcomes, was explored by Shamim et al. [7]. Their method improved tongue lesion screening by using an ensemble approach that combined CNN classification with physician evaluation for misclassified images, achieving 100% accuracy in both binary (benign vs. precancerous) and multiclass classification (hairy tongue, geographic tongue, strawberry tongue, oral hairy leukoplakia). Song et al. [10] developed an attention branch network using ResNet18 as baseline, integrated with Squeeze-and-Excitation blocks. This approach improved both model interpretability and performance, achieving 87.7% accuracy, 86.8% sensitivity, and 88.6% specificity. By manually editing the attention maps generated by the CNN, the authors further improved the model’s performance to 90.3% accuracy, 89.9% sensitivity, and 90.8% specificity. They suggested that these attention maps could assist in biopsy planning.
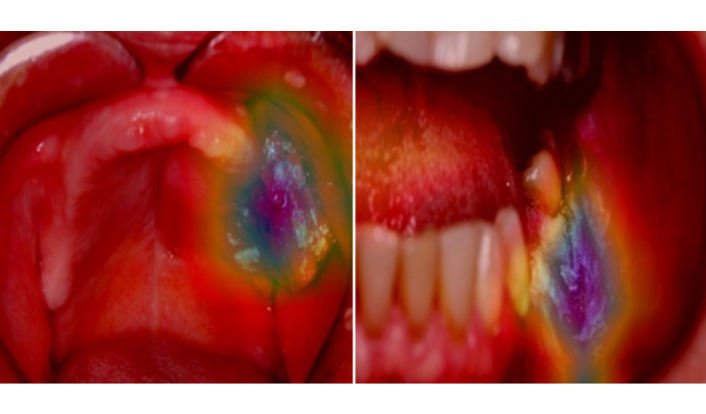
Few studies have incorporated interpretability into CNNs [1–3, 10, 13, 14, 17, 20, 31] (Figure 2) by employing class activation mapping [42], gradient-weighted class activation mapping [43], eXplanation with ranked area integrals [44], attention rollout [45], and local interpretable model-agnostic explanations [46] methods. These explainability methods play a crucial role in understanding CNN decision-making, providing insights into the contribution and importance of different input features.
Predicting the risk of malignant transformation (MT) in OPMD and assessing the risk of OSCC have been widely explored through ML- and DL-based models. Models that utilize clinical and demographic information stand out for their simplicity of input. Alhazmi et al. [28] developed an artificial neural network (ANN) prediction model based on natural language processing and data mining, incorporating 29 inputs derived from risk factors, systemic medical conditions, and clinicopathological features to predict the risk for OSCC. The model achieved 78% accuracy, 85.71% sensitivity and 60% specificity. This model holds the potential to be applied as a screening method for predicting individual’s risk for OSCC development. Rosma [30] developed two natural language processing-based pipelines using patient’s demographic profile and risk habits. The fuzzy neural network model achieved 59.9% accuracy, 45.5% sensitivity, and 85.3% specificity, while the fuzzy regression model reached 67.5% accuracy, 69% sensitivity, and 64.7% specificity. These results demonstrate that simpler methods can offer good specificity but often sacrifice sensitivity. Shimpi et al. [36] developed an oral cancer risk assessment tool for clinical decision support based on clinical variables associated to high-risk OSCC and a voting algorithm that uses decision tree, radial basis function and multilayer perceptron (MLP) classifiers. The voting system reached 78% accuracy, 64% recall, 88% precision, 92% specificity, and 0.83 AUC in predicting patients with oral cancer. The exclusion of irrelevant variables, such as chemotherapy and alcohol abuse, was essential for improving performance, highlighting the importance of a feature selection step. This demonstrates that the best results are not necessarily achieved through the complexity of the pipeline, but rather through the selection of the most descriptive characteristics.
Advances in image-based models include both supervised and unsupervised methods. Ferrer-Sánchez et al. [31] proposed two multi-task CNN for risk prediction and dysplasia grading using standard digital photographs of leukoplakia. The single-label model outperformed the multi-task models for risk assessment (0.74 accuracy, 1 sensitivity and 0.69 specificity), and high-risk dysplasia prediction (0.76 accuracy, 0.85 sensitivity and 0.74 specificity). Zhang et al. [39] implemented Inceptionv3 to develop a risk stratification model based on WSI. The model achieved 95.4% accuracy in classifying “tumor-like” and “nondysplastic-like” image patches. Patients with high-risk lesions had a 52.5% probability of developing OSCC within 5 years, compared to 21.3% in those with low risk. Cai et al. [40] developed a powerful pathomics-based model to predict the MT of oral leukoplakia using H&E-stained images from multicenter cohorts. The model achieved high predictive performance (AUC: 0.899 in the validation set, 0.813 in the testing set), outperforming dysplasia grading (AUC: 0.743). Mahmood et al. [34] developed multivariate models based on histopathological descriptors to predict MT (AUROC of 0.77) and disease recurrence (AUROC of 0.74), surpassing conventional WHO systems. Bashir et al. [29] explored weekly supervised DL algorithms to predict MT from WSIs of oral epithelial dysplasia (OED) with iterative drawand-rank sampling with an AUC of 0.78. This method is superior as it dynamically learns the representations. Wang et al. [37] developed two random forest (RF) models based on visually enhanced lesion (VEL) scope and toluidine blue (TB) scores (Model-B) and another incorporating both scores along with additional patient information, such as lesion clinical type, site, infiltration, and age (Model-P). Both models performed similarly, but Model-P demonstrated superior sensitivity, emphasizing the importance of integrating clinical features into pipeline construction. The authors also developed the OPMDRisk web app to assist clinicians worldwide in early cancer risk assessment.
Ingham et al. [32] proposed two approaches for predicting MT in OED: one using a ML algorithm and another employing traditional principal component analysis-linear discriminant analysis (PCA-LDA) algorithm based on Fourier transform infrared spectroscopy. The ML algorithm outperformed PCA-LDA, achieving higher overall sensitivity and specificity (84% and 79%, respectively) compared to PCA-LDA (79% and 79%). Liu et al. [33] applied a classical ML model to assess cancer risk based on exfoliative cytology, histopathology and clinical data, achieving 100% sensitivity and 99.2% specificity. The authors used the Peaks-RF model to create an index for quantitatively assessing oral cancer risk (OCRI2 < 0.5 for low-risk and OCRI2 ≥ 0.5 for high-risk patients). Among patients with OCRI2 ≥ 0.5, 36% developed MT, while only 5.3% of low-risk patients progressed to cancer. Shephard et al. [35] proposed a model for MT prediction based on nuclei detection, segmentation and interpretation of morphological and spatial features, ultimately introducing a scoring system that performed well in predicting dysplasia progression. Patches highly predictive of MT were associated with lymphocyte infiltration, suggesting that whole-specimen analysis, rather than focusing solely on the epithelium, may enhance image-based OPMD processing. Wu et al. [38] developed several models to predict MT based on 35 features encompassing demographic, clinical, and pathological information. The gradient boost classifier performed best, achieving 80% accuracy in MT prediction, with dysplasia emerging as the most important feature. Logistic regression, RF, and LDA also performed well, all reaching 73% accuracy, with dysplasia grade and history of multiple lesions being the most significant features. This underscores the substantial impact of feature selection on model performance.
The studies analyzed present several limitations that impact their generalizability and validity. Sample size constraints are a common issue, with some relying on small datasets [34, 37, 39], which may introduce bias, particularly when purposive sampling is used [34] or when cohort from a singles site is used for model development and validation [28]. The lack of diversity further limits the applicability of findings, as certain datasets are restricted to specific racial and ethnic groups, such as the white, non-Hispanic/Latino population [36]. Data sources also present challenges, with some studies being retrospective and relying on a single center or a sole pathologist for annotation, which may reduce reproducibility [35]. Additionally, missing or incomplete data, such as the absence of standardized biopsy techniques, variations in clinical practice, and confounding factors like alcohol consumption, further complicate the interpretation of results [36, 38]. Some ML models also fail to incorporate crucial variables, including socioeconomic and genetic factors, which are essential for a more comprehensive analysis [38]. Furthermore, the grading of epithelial dysplasia carries a degree of subjectivity depending on the pathologist analyzing the case, potentially affecting consistency in annotations. To mitigate this issue, some studies have implemented strategies such as transfer learning and data augmentation techniques to enhance model training despite small sample sizes [31]. These limitations highlight the need for larger, more diverse, and prospectively designed studies to improve the robustness and clinical applicability of AI-driven diagnostic models.
Choosing the best model for a specific task is impractical due to the vast variability in methodologies and the unique characteristics of each model. A relevant example of this is the work of Warin and collaborators [13–15]. Since the authors used a similar data set and methods across three studies, it is possible to fairly compare the architectures. We can only assume that differences in parameters and hyperparameters played a role in the subtle differences that the performance of CNNs. This exemplifies the fact that there is no single “best CNN” for a specific application; rather, several factors directly influence CNN performance.
Most studies have trained CNNs to classify images at the “image-level label” [2, 4, 7, 8] by resizing these images to fit the CNN kernels. Camalan et al. [1] took an alternative approach, fragmenting clinical photographs into smaller patches and assigning labels based on the majority of pixels (80%) associated to a given class based on the manual annotation provided by the experts.
In many published studies, malignant samples are more frequently misclassified. Tanriver et al. [11] argues that misclassification of suspicious lesions (OSCC and OPMD) is not a significant risk, as both lesions will be referred for further examination, whereas misclassifying benign lesions will lead to unnecessary referrals. However, we contend that misclassifying malignant samples is the worst possible outcome, particularly in the context of non-invasive screening methods of OSCC. According to Sharma et al. [8], despite good performance in classifying the normal (100%) and the pre-malignant (7 among 9; 78%) cases, CNN misclassifies the malignant cases more frequently, with a sensitivity of only 43%. This is especially worrisome in the context of missing a cancer diagnosis.
It is important to highlight that most published applications are supervised learning, meaning that CNN training relies on labeled data corresponding to actual diagnoses or outcomes. Consequently, all relevant image features learned by the model are linked to specific classes, providing a meaningful reference. However, the reliance on large volumes of annotated data, the risk of overspecialization in specific features of the training set, and the dependence on ground truth annotations are significant concerns. Araújo et al. [47] identified notable variability in clinicians’ interpretations of lesion features and delineation, potentially affecting annotation quality. Their study analyzed the mean pixel-wise intersection over union (IoU), revealing an average IoU of 0.53 (± 0.22), confirming discrepancies among annotators. To minimize errors in reference data for model training, it is recommended to merge annotations from at least three experienced stomatologists. Additionally, unsupervised segmentation methods risk excluding crucial lesion areas, making supervised methods preferable.
The need for standardized protocols in data collection is a great concern of researchers. Several standardized protocols exist for image acquisition to enhance model generalizability and ensure consistency. Proposed guidelines for clinical imaging of oral lesions may include uniform lighting, standard camera settings, and proper lesion framing, fixed focal distances and cross-polarized lighting to minimize glare and improve image quality [48]. Implementing such guidelines can significantly improve dataset quality but there is no evidence regarding the impact of such standardization in model robustness. Lin et al. [20] investigated the impact of centering lesions in the model’s performance and found that this approach yielded better results than random positioning, achieving 83% sensitivity, 96.6% specificity, 84.3% precision, and an 83.6% F1-score. However, this improvement may stem from a specific bias: consistently centering lesions could create patterns that favor memorization rather than genuine learning, leading to deceptively high-performance metrics. To mitigate this risk, datasets should incorporate variability, even at the cost of lower performance metrics. Therefore, despite following good practice recommendations for clinical imaging, it is crucial to ensure diversity in image acquisition conditions, such as lesion positioning, varying angles, lighting, different capturing devices, and image resolutions. This approach enhances the model’s ability to generalize across different real-world scenarios, ultimately improving its robustness and clinical applicability.
The need to incorporate variability in the models training also aligns with the need to ensure scalability of the proposed AI solutions. In clinical practice, a scalable AI model needs to handle different types of image capture equipment (e.g., photographic cameras and cellphones, different images’ size and resolution), variations in patient data, and changes in clinical protocols, ensuring broad and reliable applicability. Scalability refers to the ability of an AI model to maintain and improve its performance as data volume, task complexity, or computational requirements increase and involve: i) computational efficiency; ii) generalization; iii) infrastructure and implementation; iv) update capability. It is essential for AI models to transition from research settings to real-world applications. A model that performs well in controlled environments (i.e., yielding good results when trained with images acquired using highly standardized protocols) but fails to generalize, integrate, or update effectively will have limited clinical utility.
The primary advantage of real-time screening methods for oral cancer, particularly those based on smartphones—such as those proposed by Fu et al. [18], González and Quintero-Rojas [19], and Song et al. [22, 24]—is that they do not require specialized training, instruments, or invasive biopsies. Smartphone-based algorithms have the potential for widespread use in point-of-care screening, particularly in low-resource settings [18, 21, 22, 24–26]. In this scenario, MobileNet and EfficientNet are preferred architectures due to their low computational cost and feasibility for smartphone applications, achieving accuracies of up to 95% [21]. However, deeper state-of-the-art architectures have also been explored [22, 23].
Despite these advancements, clinicians remain resistant to adopting these AI-driven diagnostic tools. This resistance stems from the lack of theoretical clinical descriptors to assist in differentiating between OPMD and OSCC, given their similar clinical presentations in some aspects, and particularly because these diagnoses fall within the spectrum of OSCC. Such ambiguity introduces potential confounding factors in model development. This limitation can be addressed by integrating human expertise and DL to improve models’ performance [7, 10]. Clinicians’ acceptance of AI models should be based on well-designed studies using well-characterized data and models that effectively separate classes. These studies should extensively evaluate results using explainability methods, which are crucial yet underutilized. Furthermore, heatmap interpretations in most studies remain subjective and merely illustrative [1–3, 10, 13, 14, 17, 20, 31].
The integration of these models into existing clinical workflows presents both opportunities and challenges such as integration with existing systems, training of professionals, and clinical acceptance. One of the main obstacles is ensuring efficient interoperability with electronic health records and clinical decision support systems, which often require standardized data formats and robust infrastructure. Additionally, models must be designed to complement, rather than disrupt, clinical routines, ensuring they provide actionable insights without increasing the cognitive load on healthcare professionals. A crucial challenge is clinician trust and adoption, which can be enhanced through transparent reporting of model performance, interpretability (e.g., using techniques like Grad-CAM for visual explanations), and continuous validation with real-world data. Furthermore, it is essential to address regulatory considerations, particularly regarding patient safety, data privacy, and model accountability. To facilitate integration, hybrid approaches that combine AI predictions with expert review can increase reliability and acceptance, allowing AI to assist, rather than replace clinical judgment. Finally, successful implementation depends on iterative feedback cycles between developers and end-users, ensuring that AI tools are both technically robust and genuinely useful in clinical practice.
The implementation of AI models in clinical workflows can occur in various ways. In oral medicine clinics, an AI model can be integrated into an electronic health record system to pre-assess images of oral lesions submitted by patients. Based on this preliminary analysis, suspicious cases can be prioritized for in-person evaluation by a specialist. In oncology hospitals, ML algorithms can be incorporated into clinical decision support systems to provide an automated second opinion on the histopathological classification of biopsies, helping pathologists identify subtle patterns and improve diagnostic accuracy. Mobile applications can be used by patients under follow-up to periodically photograph oral lesions [19, 20, 22, 25, 26, 49]. AI models can analyze these images and alert healthcare professionals if suspicious changes are detected, facilitating remote monitoring and early interventions. In head and neck cancer radiotherapy centers, predictive models can estimate the risk of severe oral mucositis before treatment begins [50], allowing personalized adjustments to radiotherapy prescriptions or preventive measures to minimize adverse effects. These examples demonstrate the utility and how AI can be integrated into clinical workflows to optimize screening, diagnosis, monitoring, and decision-making, improving efficiency and precision in patient care.
AI models have the potential to significantly enhance clinical decision-making by serving as decision-support tools rather than standalone diagnostic systems. These models can assist practitioners by providing probabilistic assessments, identifying patterns that may be overlooked, and reducing diagnostic variability. One of the key advantages of AI-driven decision support is its ability to process large volumes of complex data efficiently, offering insights that can aid in early detection, risk stratification, and treatment planning. For example, in the context of oral pathology, AI models can highlight regions of interest in histopathological slides or clinical images, guiding pathologists toward areas that warrant closer inspection [51]. However, despite these advantages, AI should never overshadow the clinician’s expertise. The nuanced nature of clinical decision-making involves factors that AI alone cannot fully capture, such as patient history, symptoms, and contextual variations in disease presentation. Overreliance on AI-generated outputs without critical evaluation may lead to misdiagnosis or inappropriate treatment recommendations.
Ensuring the continuous improvement of AI models is essential for their successful implementation in clinical practice. As new data becomes available, model retraining is necessary to maintain accuracy and adaptability to evolving disease patterns, imaging techniques, and demographic variations. Without periodic updates, models risk becoming outdated, leading to decreased performance and potential biases. Therefore, future studies should emphasize mechanisms for ongoing validation, integration of new patient cohorts, and the incorporation of real-world clinical feedback. Establishing standardized protocols for model updates and re-evaluations will be crucial in bridging the gap between research and practical application, ultimately improving diagnostic reliability and patient outcomes.
Patient-specific factors play a crucial role in the performance and applicability of AI models in clinical settings. Variations in age, sex, underlying conditions, and even lifestyle factors may contribute to differences in disease manifestation, influencing model predictions. Some studies have incorporated demographic and clinical variables into their models, while others rely solely on imaging features, potentially overlooking key contributors to disease progression and risk stratification. A promising approach involves the integration of multimodal AI models that combine various data inputs, such as histopathological or radiological images alongside demographic and clinical information. These models can enhance predictive accuracy by leveraging complementary data sources, leading to more personalized and clinically relevant outcomes. The inclusion of diverse patient populations and a broader range of clinical parameters is essential to improving the robustness and fairness of AI models, ensuring their effectiveness across different demographic and clinical subgroups. Future studies should emphasize the integration of multimodal AI approaches into model training and validation processes to enhance generalizability and minimize potential biases. Nevertheless, researchers should recognize that CNNs are performing exceptionally well. These algorithms may identify intrinsic image patterns that are not immediately apparent to the human eye. Instead of skepticism, researchers should embrace the potential of novel image processing techniques. These tools hold great promises for reducing referral delays by general practitioners to oral medicine specialists, ultimately improving patient outcomes.
Sample size limitations are a critical factor influencing the reliability and generalizability of AI models in healthcare. Several studies included in this review relied on small or single-center datasets, which may introduce bias and limit the external validity of their findings [1, 5, 7, 8, 11, 12, 17, 21, 27, 47]. Smaller datasets can lead to overfitting, where models learn patterns specific to the training set rather than generalizable features applicable to broader populations. To mitigate these issues, many studies have employed techniques such as data augmentation and transfer learning to enhance model performance despite limited data availability. Additionally, future research should prioritize the inclusion of larger, more diverse, and multi-institutional datasets to improve model robustness and ensure clinical applicability across different populations and healthcare settings. Addressing these limitations is essential for the development of AI models that can be effectively translated into real-world practice.
Long-term validation is essential to ensure the reliability of models. However, most published studies fall into categories of internal validation considering the TRIPOD classification [52, 53]. For a robust long-term assessment, level 4 studies (external validation) would be required. While the importance of longitudinal studies to monitor model performance and strategies for continuous updates with new data is undeniable, there is still insufficient evidence to support this discussion.
Lack of performance metrics in reporting is a consistent flaw. In previous work, our team emphasized the importance of using standardized and consistent performance metrics for evaluating ML models, particularly in medical contexts. Relying on simplistic metrics like accuracy can be misleading, especially in imbalanced datasets, and may not fully represent the model’s ability to meet clinical needs. Metrics like sensitivity, specificity, precision, F1-score, and AUC provide more comprehensive insights into the model’s true performance, especially in the context of cancer diagnosis and survival analysis [54]. We have shown that multiple evaluation metrics should be reported in research to ensure a holistic understanding of a model’s effectiveness.
In medical approaches, the cost of a false negative (FN) is particularly critical, as it means a malignant condition is incorrectly classified as benign, potentially delaying necessary treatment and worsening patient outcomes. This can lead to disease progression, reduced survival rates, and increased healthcare costs due to more intensive treatments required at later stages. Therefore, minimizing FNs is a primary concern in diagnostic AI models, often requiring a trade-off with false positives (FP), which, while leading to unnecessary follow-up tests or biopsies, are generally considered less harmful than missed diagnoses [54, 55].
The model should achieve a high level of accuracy, but results should be interpreted carefully, as imbalanced datasets may highly impact the results.
High sensitivity is crucial to minimize FN, especially in cancer detection, where missing a diagnosis can have severe consequences.
The AUC should be ≥ 0.90 to indicate strong discriminatory power [18].
For segmentation tasks, a Dice coefficient of ≥ 0.80 and an IoU of ≥ 0.70 could be considered successful [11].
The model should perform consistently across diverse datasets, including external validation cohorts, to ensure it is not overfitted to a specific population. However, a drop in performance is expected when tested on external datasets.
The model should provide actionable insights that improve clinical workflows.
The model should include explainability features, such as Grad-CAM or attention maps [7, 22].
The model should maintain performance across variations in image quality, lighting, and patient demographics [1].
The model should be validated in real-world clinical settings, not just on curated datasets. Metrics such as precision, recall, and F1-score should remain stable when applied to real-world data [13].
The integration of AI models into clinical workflows for early diagnosis and risk stratification of oral cancer show promising results, especially for early and non-invasive detection of OSCC. Real-time screening, using photo-based approaches, offers non-invasive diagnosis without the need for specialized instruments. Supervised models with well-annotated data provide reliable benchmarks and improve interpretability. However, achieving accessibility and scalability remains a key goal, and clinicians’ resistance to accepting these algorithms remains a challenge. To encourage acceptance, continuous development and validation of ML models with well-characterized data and explainability of the methods is essential. Combined with user-friendly interfaces, this can pave the way for widespread adoption in low resource settings and significantly improve patient outcomes and disease prognosis.
AI: artificial intelligence
ANN: artificial neural network
AUC: area under the curve
CNNs: convolutional neural networks
DL: deep learning
FN: false negative
HSV1: herpes simplex virus type 1
IoU: intersection over union
ML: machine learning
MLP: multilayer perceptron
MT: malignant transformation
OED: oral epithelial dysplasia
OPMD: oral potentially malignant disorders
OSCC: oral squamous cell carcinoma
PCA-LDA: principal component analysis-linear discriminant analysis
RF: random forest
During the preparation of this work the authors used ChatGPT (March 14 version) from OpenAI (https://chat.openai.com/chat) in order to specifically review grammar and spelling. After using this tool/service, the authors reviewed and edited the content as needed and took full responsibility for the content of the publication. No large language models/tools/services were used to analyze and draw insights from data as part of the research process.
ALDA: Conceptualization, Investigation, Writing—original draft, Writing—review & editing. CMP: Writing—review & editing. PAV: Writing—review & editing. MAL: Writing—review & editing. ARSS: Conceptualization, Writing—review & editing.
The authors declare that there are no conflicts of interest.
This study is in accordance with the Declaration of Helsinki and was approved by the Piracicaba Dental Ethical Committee, Registration number: 42235421.9.0000.5418.
The informed consent to participate in the study was obtained from all participants.
Informed consent to publication was obtained from relevant participants.
Not applicable.
This study was financed, in part, by the São Paulo Research Foundation (FAPESP) [#2021/14585-7, #2022/07276-0], Brasil. The funders had no role in study design, data collection and analysis, decision to publish, or preparation of the manuscript.
© The Author(s) 2025.
Open Exploration maintains a neutral stance on jurisdictional claims in published institutional affiliations and maps. All opinions expressed in this article are the personal views of the author(s) and do not represent the stance of the editorial team or the publisher.
Copyright: © The Author(s) 2025. This is an Open Access article licensed under a Creative Commons Attribution 4.0 International License (https://creativecommons.org/licenses/by/4.0/), which permits unrestricted use, sharing, adaptation, distribution and reproduction in any medium or format, for any purpose, even commercially, as long as you give appropriate credit to the original author(s) and the source, provide a link to the Creative Commons license, and indicate if changes were made.

Xin-Jia Cai
Eduardo D. Piemonte ... Jerónimo P. Lazos
Kehinde Kazeem Kanmodi ... Jacob Njideka Nwafor
Romina Andrian ... Gerardo Gilligan
Caique Mariano Pedroso ... Alan Roger Santos-Silva
Márcio Diniz-Freitas ... Pedro Diz-Dios
Gerardo Gilligan ... Eduardo Piemonte
Simon A. Fox, Camile S. Farah
Constanza B. Morales-Gómez ... Víctor Beltrán