Original Article


Affiliation:
1School of Basic Medicine and Clinical Pharmacy, China Pharmaceutical University, Nanjing 211198, Jiangsu, China
2Department of Pharmacy, Nanjing First Hospital, Nanjing Medical University, Nanjing 210001, Jiangsu, China
†These authors have contributed equally to this research paper and share the first authorship.
ORCID: https://orcid.org/0009-0001-0429-4136

 ,
Affiliation:
1School of Basic Medicine and Clinical Pharmacy, China Pharmaceutical University, Nanjing 211198, Jiangsu, China
2Department of Pharmacy, Nanjing First Hospital, Nanjing Medical University, Nanjing 210001, Jiangsu, China
†These authors have contributed equally to this research paper and share the first authorship.
ORCID: https://orcid.org/0009-0004-1365-5599
,
Affiliation:
1School of Basic Medicine and Clinical Pharmacy, China Pharmaceutical University, Nanjing 211198, Jiangsu, China
2Department of Pharmacy, Nanjing First Hospital, Nanjing Medical University, Nanjing 210001, Jiangsu, China
†These authors have contributed equally to this research paper and share the first authorship.
ORCID: https://orcid.org/0009-0000-2204-6497
,
Affiliation:
1School of Basic Medicine and Clinical Pharmacy, China Pharmaceutical University, Nanjing 211198, Jiangsu, China
2Department of Pharmacy, Nanjing First Hospital, Nanjing Medical University, Nanjing 210001, Jiangsu, China
ORCID: https://orcid.org/0009-0008-4479-948X
,
Affiliation:
3School of Biology and Basic Medical Science, Soochow University, Suzhou 215123, Jiangsu, China
ORCID: https://orcid.org/0009-0004-4087-9053
,
Affiliation:
4State Key Laboratory of Natural Medicines, China Pharmaceutical University, Nanjing 210009, Jiangsu, China
ORCID: https://orcid.org/0009-0008-1256-9698
,
Affiliation:
1School of Basic Medicine and Clinical Pharmacy, China Pharmaceutical University, Nanjing 211198, Jiangsu, China
2Department of Pharmacy, Nanjing First Hospital, Nanjing Medical University, Nanjing 210001, Jiangsu, China
Affiliation:
1School of Basic Medicine and Clinical Pharmacy, China Pharmaceutical University, Nanjing 211198, Jiangsu, China
2Department of Pharmacy, Nanjing First Hospital, Nanjing Medical University, Nanjing 210001, Jiangsu, China
ORCID: https://orcid.org/0009-0008-8183-7756
,
Affiliation:
1School of Basic Medicine and Clinical Pharmacy, China Pharmaceutical University, Nanjing 211198, Jiangsu, China
2Department of Pharmacy, Nanjing First Hospital, Nanjing Medical University, Nanjing 210001, Jiangsu, China
Email: zoujianjun100@126.com
ORCID: https://orcid.org/0000-0003-0886-3153

Explor Digit Health Technol. 2026;4:1011104 DOI: https://doi.org/10.37349/edht.2026.1011104
Received: April 30, 2026 Accepted: August 13, 2026 Published: October 22, 2026
Academic Editor: James M. Flanagan, Imperial College London, UK
Aim: Breast cancer recurrence (BCR) remains a major determinant of poor outcomes in low- and middle-income countries (LMICs), where context-specific predictive tools are limited. We aimed to evaluate Boruta-based feature selection for identifying relevant predictors and compare multiple machine learning (ML) classifiers for predicting two-year postoperative BCR in a Tanzanian cohort.
Methods: In this retrospective methodological study, data from 199 surgically treated breast cancer (BC) patients were analyzed. Boruta feature selection was applied to identify relevant predictors, followed by model development using six classifiers: logistic regression (LR), random forest, naïve Bayes, multilayer perceptron, support vector machine, and LightGBM. Models were trained using 10-fold cross-validation and evaluated on an internal hold-out test set (n = 60). Performance was assessed using AUROC, AUPRC, calibration, and decision curve analysis (DCA).
Results: Boruta identified six key predictors, including tumour grade, lymph node involvement, and tumour size. Discrimination was comparable across models. LR demonstrated the strongest calibration and clinical utility, achieving an AUROC of 0.91 and an accuracy of 0.87. Although more complex models achieved comparable discrimination, they did not consistently outperform LR. DCA confirmed the superior clinical utility of the LR model across all relevant thresholds.
Conclusions: In resource-constrained settings, a parsimonious LR model combined with Boruta-selected features provides robust, interpretable, and clinically applicable prediction of BCR, pending external validation in larger, diverse cohorts. These findings highlight that increased model complexity does not necessarily translate into improved performance in small clinical datasets and support the adoption of transparent, context-appropriate tools in LMICs.
Breast cancer (BC) remains the most commonly diagnosed malignancy and the leading cause of cancer-related mortality among women worldwide, accounting for approximately 2.3 million new cases and 685,000 deaths in 2020 [1]. Despite substantial advances in early detection and multimodal treatment that have improved survival in high-income countries, the burden of BC continues to rise disproportionately in low- and middle-income countries (LMICs), where healthcare resources are often limited [2, 3]. In sub-Saharan Africa, patients frequently present at advanced stages, and survival outcomes remain poor due to limited access to early detection and treatment services [4–6]. Tanzania exemplifies this disparity, with BC representing the second most prevalent cancer among women, contributing to over 3,000 new cases and 1,300 deaths in 2018, and projected to increase by more than 80% by 2030 [7]. BC survival in these settings is significantly lower compared with high-income countries, and a considerable proportion of patients experience recurrence within five years, with high-risk individuals relapsing within the first two years, often reflecting aggressive tumour biology and resistance to therapy [8]. A major clinical challenge in this context is postoperative BC recurrence (BCR), defined as the reappearance of disease following a period of remission after surgical treatment [7].
Numerous machine learning (ML) models have been developed to predict BCR using data from cohorts in North America, Europe, and East Asia [9, 10]. For instance, Zeng et al. [11] (2023) utilized a long short-term memory (LSTM) network within a Chinese population and achieved promising discrimination. Similarly, Wu et al. [12] (2017) developed and validated personalized prognostic models for BC recurrence and overall survival using multidimensional data from patients treated at MD Anderson Cancer Center in the United States. They also developed race-specific and receptor subtype-specific models, highlighting the potential value of incorporating population characteristics into individualized prognostic assessment. However, models trained predominantly on Caucasian or Asian cohorts may perform sub-optimally in African patients, who often present with more aggressive subtypes, younger age at diagnosis, and distinct genetic backgrounds [13, 14]. These differences underscore the importance of developing and validating population-specific predictive tools.
To address this gap, Iddi et al. [15] (2025) introduced the inaugural ML-based risk prediction model for postoperative BCR specifically tailored to the Tanzanian population. Utilizing retrospective data from 199 patients treated at the Mnazi Mmoja Hospital and Ocean Road Cancer Institute, the authors conducted a comparative analysis of six ML algorithms: logistic regression (LR), extreme gradient boosting (XGBoost), random forest (RF), multilayer perceptron (MLP), light gradient boosting machine (LightGBM, or LGBM), and categorical boosting (CatBoost). Through univariate screening and least absolute shrinkage and selection operator (LASSO) regression, they identified five predictors of two-year BCR: lymph node metastasis, tumour grade, number of involved lymph nodes, tumour size, and marital status. The MLP demonstrated the highest test-set performance, achieving an area under the receiver operating characteristic curve (AUROC or ROC-AUC) of 0.935 [95% confidence interval (CI): 0.878–0.992], an accuracy of 0.850, a sensitivity of 0.875, and a specificity of 0.800. Subsequently, the model was implemented as a web-based risk calculator for clinical application in Tanzania.
Despite this advance, the exclusive use of LASSO regression for feature selection warrants further investigation. LASSO may overlook complex nonlinear relationships and interactions between variables [16]. The Boruta algorithm provides an alternative approach for feature selection in this context [17]. We evaluate whether Boruta-selected features, when integrated with various classifiers, achieve robust predictive performance in this Tanzanian cohort. Furthermore, we aim to assess whether increased model complexity offers a meaningful predictive advantage over an LR-based nomogram in the context of small sample sizes and limited resources. This comparison has direct implications for clinical implementation decisions in environments where interpretable and accessible tools are essential.
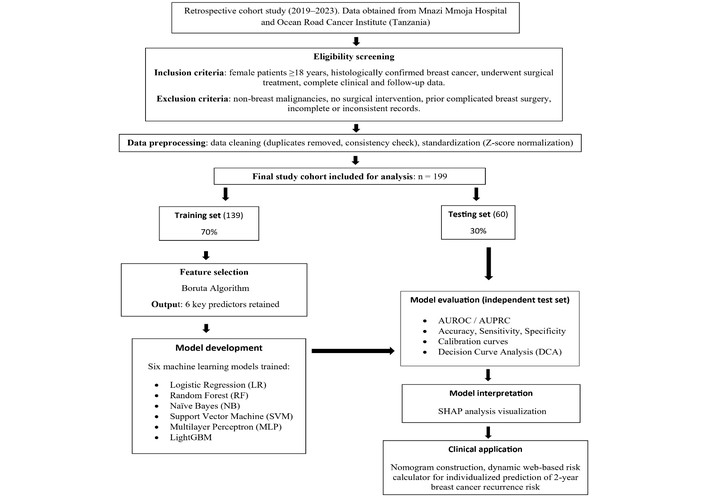
This retrospective methodological comparison study employed the dataset initially described by Iddi et al. [15] for BC patients who underwent surgical procedures at Mnazi Mmoja Hospital (Zanzibar) and Ocean Road Cancer Institute (Dar es Salaam, Tanzania) from 2019 to 2023. In accordance with the data availability statement in the original publication, a fully anonymized dataset was procured from the corresponding authors. All patient data, encompassing demographics, clinical characteristics, pathological reports, and two-year follow-up recurrence status, were preserved in their original form to ensure direct comparability of results (Figure 1). This study adhered to the Transparent Reporting of a Multivariable Prediction Model for Individual Prognosis or Diagnosis (TRIPOD) guidelines [18].
The inclusion and exclusion criteria for this study were carefully aligned with those of the original research to ensure consistency and comparability of results. Eligible participants were female patients aged 18 years or older with a histologically confirmed diagnosis of primary invasive BC who had undergone surgical treatment as part of their clinical management. Exclusion criteria were applied to patients whose diagnosis was not BC, who did not receive surgery as part of their treatment plan, or who had a history of prior breast surgery complicated by ongoing surgical issues and patients with insufficient follow-up were excluded rather than assumed to be recurrence-free.
The primary outcome was BCR within two years following surgery, which included local, regional, or distant metastatic recurrence, in accordance with the original study’s definition. The time to BCR was calculated from the date of diagnosis to the date of the first recorded recurrence, last follow-up contact, or death. Patients who died without documented recurrence or were lost to follow-up were censored at the date of their last contact. The variable “tumour size within two years” refers to tumour size measured during the two-year postoperative follow-up period and is distinct from “tumour size at diagnosis”, which was measured at baseline. Because the postoperative measurement could introduce temporal leakage, we performed a sensitivity analysis excluding it. The original 7:3 random split was maintained, resulting in a training set comprising 139 patients and an internal hold-out test set of 60 patients. Baseline demographic and clinical characteristics of the training cohort are presented in Table 1.
Baseline demographic and clinical characteristics of the study cohort.
| Variable | Overall(n = 139) | Non-recurrence(n = 34) | Recurrence(n = 105) | P-value |
|---|---|---|---|---|
| Marital status | ||||
| Unmarried | 6 (4.3%) | 0 (0.0%) | 6 (5.7%) | 0.014 |
| Married | 109 (78.4%) | 23 (67.6%) | 86 (81.9%) | |
| Divorced | 24 (17.3%) | 11 (32.4%) | 13 (12.4%) | |
| Education level | ||||
| Primary | 27 (19.4%) | 2 (5.9%) | 25 (23.8%) | |
| Secondary | 80 (57.6%) | 22 (64.7%) | 58 (55.2%) | |
| Certificate | 1 (0.7%) | 1 (2.9%) | 0 (0.0%) | |
| Diploma | 2 (1.4%) | 0 (0.0%) | 2 (1.9%) | |
| Degree | 29 (20.9%) | 9 (26.5%) | 20 (19.0%) | |
| Occupation | ||||
| Housewife | 65 (46.8%) | 19 (55.9%) | 46 (43.8%) | 0.395 |
| Entrepreneur | 35 (25.2%) | 6 (17.6%) | 29 (27.6%) | |
| Others | 39 (28.1%) | 9 (26.5%) | 30 (28.6%) | |
| Insurance | 42 (30.2%) | 13 (38.2%) | 29 (27.6%) | 0.339 |
| Alcohol consumption | 30 (21.6%) | 7 (20.6%) | 23 (21.9%) | > 0.999 |
| Smoking consumption | 8 (5.8%) | 2 (5.9%) | 6 (5.7%) | > 0.999 |
| Past history of other cancer | 12 (8.6%) | 3 (8.8%) | 9 (8.6%) | > 0.999 |
| Exposure to drug | 17 (12.2%) | 3 (8.8%) | 14 (13.3%) | 0.692 |
| BC detection mode | 62 (44.6%) | 14 (41.2%) | 48 (45.7%) | 0.792 |
| Chemotherapy | 133 (95.7%) | 33 (97.1%) | 100 (95.2%) | > 0.999 |
| Palliative | 2 (1.4%) | 2 (5.9%) | 0 (0.0%) | 0.094 |
| Radiotherapy | 6 (4.3%) | 0 (0.0%) | 6 (5.7%) | 0.347 |
| Hormonal therapy | 1 (0.7%) | 1 (2.9%) | 0 (0.0%) | 0.551 |
| Name of operation | ||||
| Radical mastectomy | 124 (89.2%) | 31 (91.2%) | 93 (88.6%) | 0.521 |
| Simple mastectomy | 13 (9.4%) | 2 (5.9%) | 11 (10.5%) | |
| Partial mastectomy | 2 (1.4%) | 1 (2.9%) | 1 (1.0%) | |
| Personal history of breast conditions | ||||
| Breast swollen | 34 (24.5%) | 10 (29.4%) | 24 (22.9%) | 0.677 |
| Breast mass | 97 (69.8%) | 22 (64.7%) | 75 (71.4%) | |
| Breast discharge | 6 (4.3%) | 1 (2.9%) | 5 (4.8%) | |
| Breast itching | 2 (1.4%) | 1 (2.9%) | 1 (1.0%) | |
| Other surgical history | 25 (18.0%) | 7 (20.6%) | 18 (17.1%) | 0.843 |
| Family history of BC | 19 (13.7%) | 4 (11.8%) | 15 (14.3%) | 0.932 |
| Family history of other cancer | 11 (7.9%) | 3 (8.8%) | 8 (7.6%) | > 0.999 |
| Beginning period before 12 years | 17 (12.2%) | 5 (14.7%) | 12 (11.4%) | 0.837 |
| Beginning menopause after 60 years | 17 (12.2%) | 3 (8.8%) | 14 (13.3%) | 0.692 |
| Having first child after age 30 | 15 (10.8%) | 4 (11.8%) | 11 (10.5%) | > 0.999 |
| Never been pregnant | 9 (6.5%) | 1 (2.9%) | 8 (7.6%) | 0.574 |
| Received hormone therapy before menopause | 30 (21.6%) | 13 (38.2%) | 17 (16.2%) | 0.013 |
| Received hormone therapy after menopause | 16 (11.5%) | 3 (8.8%) | 13 (12.4%) | 0.798 |
| Tumour marker after surgery | ||||
| CA_15_3 | 79 (56.8%) | 20 (58.8%) | 59 (56.2%) | 0.271 |
| CA_27_29 | 36 (25.9%) | 11 (32.4%) | 25 (23.8%) | |
| CA_125 | 24 (17.3%) | 3 (8.8%) | 21 (20.0%) | |
| Abdominopelvic imaging, n (%) | 80 (57.6%) | 22 (64.7%) | 58 (55.2%) | 0.441 |
| Distant organ metastasis, n (%) | 42 (30.2%) | 8 (23.5%) | 34 (32.4%) | 0.446 |
| Estrogen receptor (ER+), n (%) | 55 (39.6%) | 10 (29.4%) | 45 (42.9%) | 0.233 |
| Progesterone receptor (PR+), n (%) | 48 (34.5%) | 10 (29.4%) | 38 (36.2%) | 0.607 |
| HER2/neu overexpressed or amplified, n (%) | 65 (46.8%) | 15 (44.1%) | 50 (47.6%) | 0.875 |
| Tumour grade | ||||
| Grade 1 | 60 (43.2%) | 27 (79.4%) | 33 (31.4%) | < 0.001 |
| Grade 2 | 34 (24.5%) | 7 (20.6%) | 27 (25.7%) | |
| Grade 3 | 36 (25.9%) | 0 (0.0%) | 36 (34.3%) | |
| Grade 4 | 9 (6.5%) | 0 (0.0%) | 9 (8.6%) | |
| Lymph node metastasis, n (%) | 86 (61.9%) | 6 (17.6%) | 80 (76.2%) | < 0.001 |
| Invasive ductal carcinoma, n (%) | 127 (91.4%) | 30 (88.2%) | 97 (92.4%) | 0.692 |
| Invasive lobular carcinoma, n (%) | 6 (4.3%) | 3 (8.8%) | 3 (2.9%) | 0.316 |
| Mixed ductal lobular, n (%) | 3 (2.2%) | 1 (2.9%) | 2 (1.9%) | > 0.999 |
| Age (years), median [IQR] | 55.0 [47.0, 63.5] | 56.0 [45.0, 63.0] | 55.0 [48.0, 64.0] | 0.553 |
| BMI (kg/m2), median [IQR] | 32.7 [28.2, 36.7] | 32.3 [28.4, 36.5] | 32.7 [28.1, 36.7] | 0.899 |
| Time since diagnosis (months), median [IQR] | 12.0 [6.0, 24.0] | 16.0 [9.8, 24.0] | 12.0 [6.0, 24.0] | 0.080 |
| Hemoglobin (g/dL), median [IQR] | 11.6 [10.6, 12.6] | 11.4 [10.5, 12.4] | 11.8 [10.6, 12.7] | 0.263 |
| RBC (× 1012/L), mean (SD) | 4.41 (0.70) | 4.38 (0.68) | 4.42 (0.71) | 0.763 |
| WBC (× 109/L), median [IQR] | 5.0 [3.9, 6.9] | 4.7 [3.6, 6.0] | 5.0 [4.1, 7.2] | 0.214 |
| NLR, median [IQR] | 1.74 [1.21, 2.48] | 1.71 [1.21, 2.50] | 1.76 [1.22, 2.42] | 0.788 |
| PLR, median [IQR] | 282 [193, 377] | 256 [166, 363] | 287 [204, 393] | 0.449 |
| Tumour size within 2 years (mm), median [IQR] | 25.0 [20.2, 30.0] | 26.0 [23.1, 30.0] | 24.5 [19.9, 30.0] | 0.029 |
| Tumour size at diagnosis (mm), median [IQR] | 23.7 [12.9, 28.2] | 21.8 [10.4, 25.2] | 24.2 [15.9, 28.7] | 0.060 |
| Number of lymph nodes involved, median [IQR] | 2.0 [0.0, 4.0] | 0.0 [0.0, 2.0] | 3.0 [1.0, 5.0] | < 0.001 |
| Number of positive nodes, median [IQR] | 2.0 [1.0, 4.0] | 1.0 [0.3, 3.0] | 3.0 [1.0, 4.0] | 0.014 |
ER: estrogen receptor; HER2: human epidermal growth factor receptor 2; IQR: interquartile range; PR: progesterone receptor; SD: standard deviation.
Continuous variables were standardized using Z-score normalization [mean = 0, standard deviation (SD) = 1], and categorical variables were transformed via one-hot encoding, consistent with the baseline study. The dataset contained no missing values, precluding the need for imputation. A data-cleaning procedure was applied to remove duplicate entries, standardize variable formats, and verify overall data consistency.
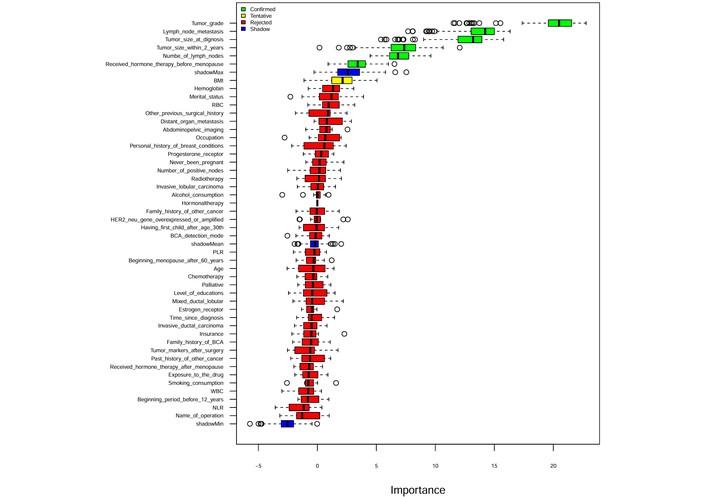
The Boruta algorithm is a RF-based all-relevant feature selection method that assesses predictor importance by comparing original features with randomly permuted ‘shadow’ counterparts [19]. Features that consistently outperform the best shadow feature across iterations are confirmed as important; those that do not are rejected. The algorithm was applied with 100 iterations, 500 trees per RF, a significance level of α = 0.05 (binomial test), and Bonferroni correction for multiple comparisons. All confirmed features formed the Boruta feature set. Our comparison focuses on classifiers trained on Boruta-selected features, with reference to LASSO-based results from Iddi et al. [15] (2025) as a contextual benchmark rather than a direct statistical comparison within a unified pipeline.
Six supervised ML algorithms were implemented to develop and compare predictive performance: LR, RF, naïve Bayes (NB), MLP, LightGBM, and support vector machine (SVM).
• LR was employed as a baseline linear classifier, modeling the log-odds of the outcome as a linear combination of predictors. To mitigate overfitting and improve generalizability, L2 regularization was applied.
• RF is an ensemble learning method based on bootstrap aggregation, constructing multiple decision trees using random subsets of the data and predictors. Final predictions were obtained via majority voting, enhancing robustness and reducing variance.
• NB is a probabilistic classifier grounded in Bayes’ theorem, assuming conditional independence among predictors. Continuous variables were modeled under a Gaussian distribution, enabling efficient and computationally lightweight classification.
• MLP is a feedforward artificial neural network consisting of an input layer, one hidden layer, and an output layer. The model was trained using back propagation, with a rectified linear unit (ReLU) activation in the hidden layer and a sigmoid activation function in the output layer to generate probabilistic predictions.
• SVM constructs an optimal hyperplane that maximizes the margin between classes. A radial basis function (RBF) kernel was utilized to capture nonlinear relationships within the data.
• LightGBM is a gradient boosting framework that builds decision trees sequentially, where each subsequent tree aims to minimize residual errors of the previous ensemble. It employs histogram-based learning and leaf-wise tree growth, resulting in high computational efficiency and strong predictive performance in structured/tabular datasets.
For each feature set-classifier combination, the following procedure was applied: (a) hyper-parameter optimization was performed on the training set (n = 139) via exhaustive grid search with 10-fold cross-validation, maximizing the mean AUROC across folds; (b) the model was retrained on the entire training set using the optimal hyper-parameters; (c) predictions were generated on the held-out internal test set (n = 60) to obtain unbiased performance estimates; and (d) the optimal classification threshold was determined using the Youden index (sensitivity + specificity − 1) applied to the training-set ROC curve.
In the training set (n = 139), there were approximately 105 events and 34 non-events. After one-hot encoding, the final LR model included 9 parameters (including intercept). The events-per-variable (EPV) ratio was 11.7 based on total events; however, more critically, the non-EPV ratio was 3.8, well below the conventional minimum of 10. This imbalance in the minority class raises concerns about model stability, which we addressed through L2 regularization and acknowledge as a limitation.
The fitted LR coefficients were used to construct a points-based nomogram. Each predictor category was assigned a point value proportional to its regression coefficient, and a total point score was calculated for each patient. The predicted probability of two-year recurrence was derived by mapping the total points to the outcome scale using the logistic function: P(recurrence) = 1 / (1 + exp(−(β₀ + Σβᵢxᵢ))).
A dynamic, web-based nomogram was implemented as an interactive application using Shiny and is publicly accessible. The LR model served as the primary model for nomogram development; comparisons are focused on different algorithmic approaches rather than different model formulations.
The performance of the nomogram was evaluated on the identical held-out internal test set (n = 60) using the same metrics described in Model evaluation and comparison to ensure direct comparability with all ML models.
All models were evaluated on the internal hold-out test set using the same metrics as in the baseline study. Discrimination was assessed by the AUROC and the area under the precision-recall curve (AUPRC), both with 95% CIs estimated by bootstrapping (1,000 resamples). At the optimal threshold, accuracy, sensitivity (recall), and specificity were calculated. Calibration was quantified and visualized with calibration plots of predicted versus observed probabilities. Clinical utility was evaluated using decision curve analysis (DCA), computing net benefit across threshold probabilities from 0 to 1.
All Boruta-trained models were compared descriptively on the same internal hold-out test set. The nomogram was treated as the baseline clinical model. For context, we also report the performance previously obtained by Iddi et al. [15] using LASSO-based feature selection; because that model was developed and evaluated within a different analytical pipeline, this comparison is contextual rather than a formal head-to-head test, and no inferential statistics are reported.
SHapley Additive exPlanations (SHAP) were applied to the best-performing model to quantify individual feature contributions to predictions [20]. Three visualization types were generated: summary plots ranking features by mean absolute SHAP value to characterize global importance; dependence plots illustrating the relationship between feature values and SHAP values to reveal nonlinear effects and interactions; and force plots providing patient-level explanations of individual predictions. SHAP-derived importance rankings were compared qualitatively with those reported by Iddi et al. [15] to identify any differences attributable to the feature selection strategy or classifier choice.
Descriptive statistics are reported as means ± SD for normally distributed continuous variables (assessed via the Shapiro-Wilk test), medians with interquartile range (IQR) for non-normally distributed variables, and frequencies with percentages for categorical variables. All statistical tests were two-sided, and p < 0.05 was considered statistically significant. All analyses were conducted using R software (version 4.3.3). All reported CIs are bootstrap-based (1,000 resamples).
This study included a total of 199 female patients who underwent surgical treatment for BC in Tanzania. Among these patients, the incidence of BCR was notably high, observed in 72.9% of cases. The dataset was randomly partitioned into a training set (n = 139) and an internal hold-out test set (n = 60) using a 7:3 split. The training cohort was utilized for feature selection and model development, whereas the test cohort was utilized for performance evaluation.
Table 1 presents the baseline demographic and clinical characteristics of the training cohort (n = 139), stratified by two-year recurrence status, indicating appropriate balance and supporting the validity of subsequent model development and evaluation.
Feature selection was performed using the Boruta algorithm as described in Feature selection.
In this study, Boruta was applied to the full set of candidate predictors (approximately 50 variables), as illustrated in Figure 2. To prevent information leakage and ensure methodological rigor, the feature selection procedure was conducted exclusively within the training dataset. The test dataset remained completely unseen during both feature selection and subsequent model development.
Of the approximately 50 candidate predictors assessed, Boruta retained six that consistently outperformed the best shadow feature across all 100 iterations: tumour grade, lymph node metastasis, tumour size at diagnosis, tumour size within two years, number of lymph nodes involved, and receipt of hormone therapy before menopause. The remaining candidates were rejected as unimportant. These six predictors represent well-established prognostic factors in BC [15] and were carried forward for model development.
In the internal hold-out test dataset, all six ML models demonstrated acceptable predictive performance (Table 2). A classifier that predicted recurrence for all patients (i.e., a majority-class baseline) would achieve 66.7% accuracy on the internal hold-out test set (40 of 60 patients), providing a contextual benchmark for the reported model performances.
Performance comparison of ML models on the internal hold-out test set (n = 60; 40 events, 20 non-events).
| Model | Accuracy | Bal. Acc. | F1-score | Kappa | MCC | NPV (95% CI) | PPV (95% CI) | PR-AUC (95% CI) | ROC-AUC (95% CI) | Sensitivity | Specificity (95% CI) |
|---|---|---|---|---|---|---|---|---|---|---|---|
| LR | 0.87 | 0.85 | 0.90 | 0.70 | 0.70 | 0.80 (0.61–0.92) | 0.90 (0.86–0.97) | 0.94 (0.89–0.98) | 0.91 (0.84–0.96) | 0.90 | 0.80 (0.62–0.94) |
| LGBM | 0.87 | 0.86 | 0.90 | 0.71 | 0.71 | 0.77 | 0.92 | 0.94 | 0.89 (0.80–0.95) | 0.875 | 0.85 |
| RF | 0.83 | 0.83 | 0.87 | 0.63 | 0.64 | 0.73 | 0.89 | 0.92 | 0.88 (0.77–0.94) | 0.85 | 0.80 |
| SVM | 0.77 | 0.81 | 0.79 | 0.54 | 0.59 | 0.59 | 0.96 | 0.96 | 0.90 (0.82–0.97) | 0.675 | 0.95 |
| MLP | 0.82 | 0.81 | 0.86 | 0.60 | 0.61 | 0.70 | 0.89 | 0.97 (0.90–0.99) | 0.93 (0.86–0.97) | 0.825 | 0.80 |
| NB | 0.80 | 0.79 | 0.85 | 0.56 | 0.56 | 0.68 | 0.87 | 0.93 | 0.88 (0.78–0.95) | 0.825 | 0.75 |
Bal. Acc.: balanced accuracy; CI: confidence interval (bootstrap, 1,000 resamples); LR: logistic regression; LGBM: light gradient boosting machine; MCC: Matthews correlation coefficient; MLP: multilayer perceptron; NB: Naïve Bayes; NPV: negative predictive value; PPV: positive predictive value; RF: random forest; SVM: support vector machine. CIs are those obtained in the primary analysis. Where point estimates were recomputed, the original bootstrap intervals are retained.
Discrimination was comparable across the six models. LR and LGBM showed the most balanced profiles: LR achieved an accuracy of 0.87, F1-score of 0.90, sensitivity of 0.90, and specificity of 0.80, while LGBM achieved an accuracy of 0.87, F1-score of 0.90, sensitivity of 0.875, and specificity of 0.85. SVM showed the highest specificity (0.95) but the lowest sensitivity (0.675), indicating a trade-off toward negative-class predictions. NB showed comparatively lower performance across most metrics. MLP achieved the highest discrimination (ROC-AUC 0.93, PR-AUC 0.97). Because LR additionally demonstrated the strongest calibration (Figure 3A) and the greatest net benefit in DCA (Figure 3B), and because it is the most parsimonious and interpretable of the six models, LR was selected as the most suitable model for clinical application (Figure 4A and 4B).
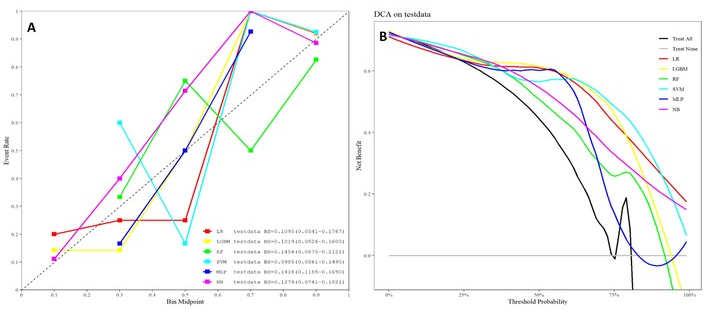
Calibration and DCA of ML models. (A) Calibration plots for the ML models on the internal hold-out test dataset. The calibration curves illustrate agreement between predicted probabilities and observed outcomes. (B) DCA for the ML models on the internal hold-out test dataset. DCA evaluates the net clinical benefit across a range of threshold probabilities. DCA: decision curve analysis.
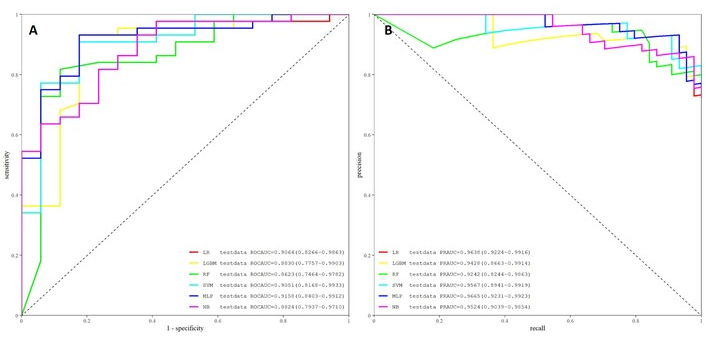
Curves comparing the performance of ML models on the internal hold-out test dataset. (A) Receiver operating characteristic (ROC) curves. (B) Precision-recall (PR). AUROC: area under the receiver operating characteristic curve; AUPRC: area under the precision-recall curve; LR: logistic regression; RF: random forest; MLP: multilayer perceptron; LightGBM: light gradient boosting machine; SVM: support vector machine; NB: naïve Bayes.
Furthermore, the calibration analysis demonstrated that the LR model achieved good agreement between predicted probabilities and observed outcomes, with the calibration curve closely approximating the ideal diagonal line across most risk thresholds (Figure 3A). Only minor deviations were observed at higher probability ranges. DCA further supported the clinical utility of the LR model (Figure 3B). LR consistently provided a higher net benefit compared with the “treat all” and “treat none” strategies across a broad range of threshold probabilities, particularly within the clinically relevant interval of approximately 0.2 to 0.8.
A nomogram was developed based on the LR model, incorporating six key predictive variables identified through Boruta feature selection: tumour grade, tumour size at diagnosis, lymph node metastasis, number of lymph nodes, tumour size within 2 years, and hormone therapy before menopause. The nomogram provides a quantitative and intuitive tool for estimating individual risk by assigning weighted scores to each predictor according to its relative contribution to the model. The nomogram represents the same model parameters as the LR model but in a graphical format suitable for clinical use (Figure 5).
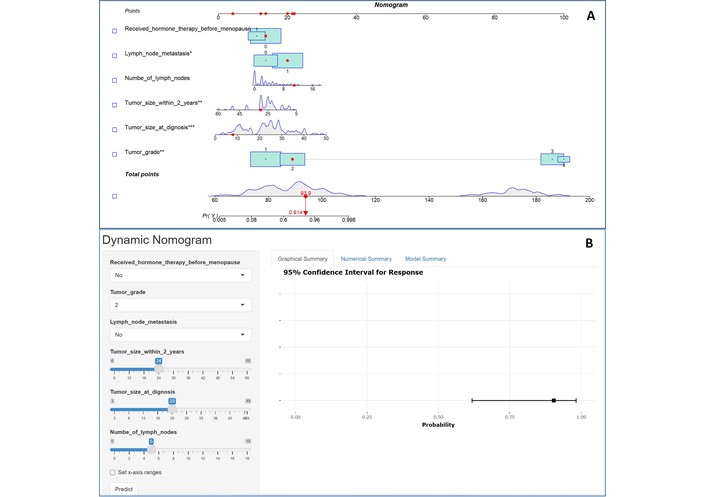
Nomogram and dynamic risk prediction tool based on the LR model. (A) Static nomogram. (B) Online web-based dynamic nomogram predicting clinical outcomes. The model provides graphical, numerical, and model summaries, with predictions visualized as 95% confidence intervals across a probability range (0.00 to 1.00).
To further enhance clinical applicability, a dynamic, web-based risk calculator was developed based on the final LR model (https://baozexiang.shinyapps.io/bca_dynnomapp/). This interactive tool allows users to input patient-specific variables and obtain real-time risk predictions, potentially assisting clinicians in identifying high-risk patients and informing tailored management strategies.
To elucidate the contribution of individual variables to the LR model, SHAP analysis was performed (Figure 6). The summary plot presents each feature ranked by importance, with the horizontal axis representing the corresponding SHAP values reflecting the direction and magnitude of each feature’s contribution. SHAP analysis identified tumour grade, tumour size at diagnosis, and lymph node metastasis as the most influential predictors, with higher values consistently associated with increased predicted risk. Tumour size within 2 years showed a less consistent and more heterogeneous effect, which may reflect measurement variability or its relationship with baseline tumour characteristics. The number of lymph nodes exhibited a modest positive contribution, whereas hormone therapy before menopause was associated with reduced predicted risk.
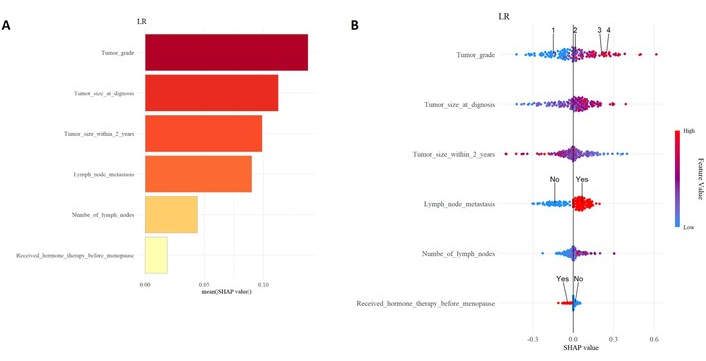
SHAP-based feature importance and interpretation. (A) SHAP feature importance based on mean absolute SHAP values. (B) SHAP summary plot illustrating the distribution and direction of feature effects.
In this study, we conducted a comprehensive comparative analysis of ML classifiers for predicting two-year postoperative BC recurrence in a Tanzanian cohort. Our findings demonstrate that while multiple ML models achieved strong discriminative performance, LR consistently provided the most balanced performance across discrimination, calibration, and clinical utility metrics. Notably, Boruta-based feature selection confirmed a clinically coherent subset of well-established prognostic predictors, reinforcing the importance of tumour burden (tumour size, nodal status) and tumour biology (grade) in recurrence risk stratification.
The balanced and stable performance of LR in our study is particularly noteworthy. Although MLP achieved slightly higher discrimination (ROC-AUC = 0.93 vs. 0.91), LR demonstrated superior calibration and decision curve performance, suggesting greater reliability for probability estimation. This finding aligns with prior evidence indicating that, in small to moderate-sized clinical datasets, simpler models often match or outperform complex algorithms due to reduced risk of overfitting and enhanced interpretability [21–23].
From a methodological standpoint, the comparison between LASSO (Iddi et al. [15]) and Boruta feature selection offers contextual insights into predictor identification [24]. It is important to note that this comparison is contextual rather than a controlled head-to-head analysis, as LASSO was not re-implemented within our analytical framework. The LASSO-driven framework yielded a parsimonious set of five variables, while Boruta identified a slightly broader, clinically coherent set including tumour size within two years and premenopausal hormone therapy alongside the core pathological features. Importantly, both approaches converged on the key determinants: lymph node metastasis, tumour grade, and tumour size, underscoring their central biological role in driving recurrence. Future work should systematically compare feature selection methods within a unified analytical pipeline.
Despite these methodological differences, overall predictive patterns remained highly consistent. The broader feature inclusivity achieved by Boruta did not translate into a substantial improvement in discrimination compared with the LASSO-based benchmark (AUROC 0.935 for Iddi et al. [15]’s MLP vs. 0.91 for our LR model); rather, it shifted the balance toward modest gains in interpretability when combined with LR. We also conducted a sensitivity analysis excluding the “tumour size within two years” variable to address potential concerns about temporal leakage. The AUROC decreased by only 0.01–0.02 across all models, with relative model rankings and conclusions regarding LR’s balanced performance remaining unchanged, indicating that our main findings are robust to its exclusion. Nevertheless, precise temporal definitions of predictors are important in clinical prediction modeling, and prospective validation should confirm the clinical utility of this predictor. The SHAP analysis revealed that this variable had a less consistent and more heterogeneous effect on predictions compared to other core predictors, consistent with this interpretation.
The SHAP analysis also revealed that pre-menopausal hormone therapy was associated with reduced predicted risk. This finding should be interpreted cautiously, as it may reflect confounding by indication: patients receiving hormone therapy may have had more favorable tumour characteristics (e.g., hormone receptor positivity) associated with lower recurrence risk. Alternatively, it may reflect the protective effect of endocrine therapy in appropriate candidates. Prospective studies with detailed treatment indications are needed to disentangle these effects.
Our findings have direct implications for clinical practice in LMICs. In resource-constrained settings such as Tanzania, predictive models must balance accuracy with interpretability and ease of implementation. The LR-based nomogram developed in this study provides a transparent and accessible tool for individualized risk prediction, aligning with global recommendations emphasizing context-appropriate models in LMIC healthcare systems [25].
Several strengths of this study should be emphasized. First, this is among the few studies to systematically evaluate classifier performance within an African BC cohort. Second, the use of an internal hold-out test set provides unbiased performance estimates. Third, the incorporation of multiple evaluation metrics, including calibration and DCA, ensures comprehensive assessment beyond discrimination alone.
However, several limitations must be acknowledged. The relatively small sample size may limit generalizability and increase the risk of model instability, particularly for more complex algorithms. The retrospective design introduces potential selection bias and limits causal inference. The effective EPV in this study warrants consideration: with 34 non-events in the training set and 9 model parameters after one-hot encoding, the non-EPV ratio was 3.8, well below the conventional minimum of 10 recommended for LR. While L2 regularization was applied to mitigate overfitting, this low EPV for the minority class reinforces the need for caution in interpreting model performance. Additionally, the internal hold-out test set (n = 60) contains only 20 non-events; a single misclassification in the non-recurrence class shifts specificity by 5 percentage points, making minority-class metrics [specificity, negative predictive value (NPV)] inherently unstable. While the LR model’s accuracy of 0.87 exceeds the 66.7% accuracy of a naïve ‘predict recurrence for all’ rule on the same test set, claims regarding robustness and generalizability must be tempered. External validation in independent cohorts, particularly across different African populations and healthcare settings, is essential before widespread clinical deployment.
Future research should focus on prospective validation and external validation across diverse African populations, as well as integration of additional data modalities such as genomic or imaging features. Implementation studies are needed to evaluate the real-world clinical impact of the dynamic nomogram in guiding treatment decisions.
This study suggests that Boruta-based feature selection, when integrated with LR, may provide clinically useful prediction of two-year postoperative BC recurrence in a Tanzanian cohort, pending external validation in larger, diverse cohorts. The Boruta algorithm confirmed well-established prognostic factors, particularly tumour grade, lymph node metastasis, and tumour size, as the dominant predictors in this population. Despite the availability of advanced ML algorithms, no meaningful performance advantage over LR was observed, underscoring the importance of model parsimony, interpretability, and robustness in small, resource-limited datasets.
The developed nomogram and dynamic web-based tool offer a practical and scalable approach for individualized risk stratification, with the potential to support clinical decision-making in LMIC settings. Future work should prioritize external validation across diverse African populations and prospective implementation studies to evaluate real-world clinical impact.
AUPRC: area under the precision-recall curve
AUROC (ROC-AUC): area under the receiver operating characteristic curve
BC: breast cancer
BCR: breast cancer recurrence
CatBoost: categorical boosting
CI: confidence interval
DCA: decision curve analysis
EPV: events-per-variable
HER2: human epidermal growth factor receptor 2
IQR: interquartile range
LASSO: least absolute shrinkage and selection operator
LightGBM (LGBM): light gradient boosting machine
LMICs: low- and middle-income countries
LR: logistic regression
MCC: Matthews correlation coefficient
ML: machine learning
MLP: multilayer perceptron
NB: naïve Bayes
NPV: negative predictive value
PPV: positive predictive value
RF: random forest
SD: standard deviation
SHAP: SHapley Additive exPlanations
SVM: support vector machine
TRIPOD: Transparent Reporting of a Multivariable Prediction Model for Individual Prognosis or Diagnosis
XGBoost: extreme gradient boosting
We would like to appreciate all the clinicians who helped to collect the data in the various hospitals. During the preparation of this work, we used ChatGPT for polishing the language of some sections. After using it, we thoroughly reviewed and edited the content as needed and take full responsibility for the content of the publication.
TMG and CSB: Conceptualization, Investigation, Writing—original draft, Writing—review & editing. ZB: Methodology, Software, Formal analysis. AKI, SE, NK, BTB, SFO: Writing—review & editing. JZ: Supervision, Writing—review & editing. All authors read and approved the submitted version.
The authors declare that there are no conflicts of interest.
This study involved a secondary analysis of fully anonymized data from an investigation that had received ethical approval from Dar-es-Salaam City in Tanzania (document number: 10/VOL.XXI/213B) and Zanzibar Health Research Ethics Committee (ZAHREC) from Zanzibar city in Tanzania (document number: ZAHREC/05/ST/OCT/2023/180). No direct patient contact occurred and all data were de-identified; no additional ethical approval or informed consent was required. All procedures were conducted in accordance with the principles of the Declaration of Helsinki and applicable ethical guidelines and regulations.
Not required as no direct patient contact occurred and all data were de-identified. This study involved a secondary analysis of fully anonymized data from an investigation that had received ethical approval.
Not applicable.
The datasets used and analysed in this study are available from the corresponding authors upon reasonable request.
Not applicable.
© The Author(s) 2026.
Open Exploration maintains a neutral stance on jurisdictional claims in published institutional affiliations and maps. All opinions expressed in this article are the personal views of the author(s) and do not represent the stance of the editorial team or the publisher.
Copyright: © The Author(s) 2026. This is an Open Access article licensed under a Creative Commons Attribution 4.0 International License (https://creativecommons.org/licenses/by/4.0/), which permits unrestricted use, sharing, adaptation, distribution and reproduction in any medium or format, for any purpose, even commercially, as long as you give appropriate credit to the original author(s) and the source, provide a link to the Creative Commons license, and indicate if changes were made.



View: 40
Download: 2
Times Cited: 0