 Original Article

Affiliation:
1Department of Gastroenterology and Hepatology, University Medical Center Groningen, University of Groningen, 9700RB Groningen, The Netherlands
†These authors contributed equally to this work.
ORCID: https://orcid.org/0000-0001-6776-0109
Affiliation:
1Department of Gastroenterology and Hepatology, University Medical Center Groningen, University of Groningen, 9700RB Groningen, The Netherlands
†These authors contributed equally to this work.
ORCID: https://orcid.org/0000-0002-9714-5809
Affiliation:
2Department of Pediatrics, University Medical Center Groningen, University of Groningen, 9700RB Groningen, The Netherlands
ORCID: https://orcid.org/0000-0003-0066-3720
Affiliation:
1Department of Gastroenterology and Hepatology, University Medical Center Groningen, University of Groningen, 9700RB Groningen, The Netherlands
3Department of Laboratory Medicine, University Medical Center Groningen, University of Groningen, 9700RB Groningen, The Netherlands
ORCID: https://orcid.org/0000-0002-8171-0797
Affiliation:
4Groningen Institute for Organ Transplantation, University Medical Center Groningen, University of Groningen, 9700AD Groningen, The Netherlands
Affiliation:
1Department of Gastroenterology and Hepatology, University Medical Center Groningen, University of Groningen, 9700RB Groningen, The Netherlands
ORCID: https://orcid.org/0000-0002-8598-1017
Affiliation:
1Department of Gastroenterology and Hepatology, University Medical Center Groningen, University of Groningen, 9700RB Groningen, The Netherlands
Email: h.blokzijl@umcg.nl
ORCID: https://orcid.org/0000-0003-4240-7506
Affiliation:
1Department of Gastroenterology and Hepatology, University Medical Center Groningen, University of Groningen, 9700RB Groningen, The Netherlands
3Department of Laboratory Medicine, University Medical Center Groningen, University of Groningen, 9700RB Groningen, The Netherlands
Email: a.j.moshage@umcg.nl
ORCID: https://orcid.org/0000-0002-4764-0246
Explor Dig Dis. 2024;3:143–162 DOI: https://doi.org/10.37349/edd.2024.00044
Received: October 11, 2023 Accepted: March 01, 2024 Published: April 28, 2024
Academic Editor: Jose Carlos Fernandez-Checa, Institute of Biomedical Research of Barcelona (IIBB), CSIC, Spain
Aim: Extracellular vesicles (EVs) have gained significant attention for their diagnostic and therapeutic potential in various diseases, including liver disorders. This study focuses on optimizing the isolation and characterization of small EVs from plasma and serum samples in patients with liver diseases, aiming to advance our understanding and potential clinical applications of EVs.
Methods: Blood samples were collected from patients with end-stage liver disease (ESLD) enlisted in the TransplantLines Cohort and Biobank Study, and healthy donors. We employed differential ultracentrifugation (DUC) to evaluate three distinct protocols: a 3-step DUC, a washing step omitted [samples without washing (WW)], and a contaminant-depleted plasma (CDP) protocol. RNA isolation methodologies were compared, involving the use of TRI-reagent or the commercial AllPrep DNA/RNA kit. Further insights into EV composition were obtained through proteomic analyses, comparing samples subjected to traditional cell lysis (L) with those processed without lysis (NL).
Results: We successfully isolated EVs from both plasma and serum samples as confirmed by the presence of specific EV markers, including CD9, CD63, CD81, and tumor susceptibility gene 101 (TSG-101). While some contaminants remained, such as albumin and lipoproteins, the protocol selected to continue EVs analysis was the 3-step protocol. Transmission electron microscopy (TEM) and nanotracking analysis (NTA) further confirmed EVs presence. RNA extraction was achieved using TRI-reagent, but not with the commercial kit highlighting the importance of selecting an appropriate method for RNA isolation. Finally, proteomics analysis showed that lysed samples were significantly more enriched in proteins compared to non-lysed samples, although protein variability was still present in both groups.
Conclusions: Optimizing EV isolation techniques is essential for harnessing their potential in liver disease diagnosis and therapy. Further refinement of purification methods, a deep characterization of our cohort and understanding the variability and cargo within EVs will be crucial for future biomarker discovery and therapeutic applications in liver-related diseases.
Extracellular vesicles (EVs) have gained great interest from both basic scientists and clinicians over the past decade, owing to their immense potential as valuable tools for diagnostics and therapeutics [1]. EVs are heterogeneous, cell-derived spheric particles and can originate from different (intra)cellular compartments, e.g., endosomes, plasma membranes, and cellular debris. They are surrounded by a 4–7 nm lipid bilayer and are classified according to their size in small-size particles (50–200 nm, exosomes), medium-size particles (≥ 200–1,000 nm, microvesicles), or large-size particles (≥ 500 nm, apoptotic bodies). They are secreted and absorbed by almost all cell types and are present in all body fluids [2, 3] and participate in intercellular communication and cell-cell signaling by transporting lipids, ions, metabolites, proteins, RNAs, or DNA in their cargo which often resembles the status of the cell of origin, making them important regulators in health and disease, including liver diseases [4].
Liver diseases represent an important cause of mortality worldwide, with over two million deaths per year (4% of the world’s total) [5]. Cirrhosis, the final stage of chronic liver diseases, has a great impact on public health since they have a large effect on disability-adjusted life-years (DALYs): 560 total age-standardized DALYs per 100,000 population [6]. Important causes of chronic liver diseases are viral, alcoholic and metabolic dysfunction associated fatty liver diseases, often leading to hepatic cancer as a consequence of cirrhosis. Currently, liver transplantation is the only curative treatment for end-stage liver disease (ESLD), hence novel early diagnostic tools (biomarkers) and therapeutical approaches are urgently needed.
All hepatic parenchymal (hepatocytes) and non-parenchymal cells [liver sinusoidal endothelial cells (LSECs), hepatic stellate cells (HSCs), cholangiocytes, and Kupffer cells (KCs)] are involved in the release and uptake of EVs [7, 8]. Similar to other EVs, liver-derived EVs express common markers, including membrane proteins such as tetraspanins (CD9, CD63, CD81) and cytoplasmatic proteins [tumor susceptibility gene 101 (TSG-101)]. In physiological conditions, liver cell-derived EVs participate in drug metabolism, the innate immune response, differentiation of LSECs and cholangiocytes, regulation of HSC activation, HSC and macrophage migration and proliferation [7, 9–12]. In chronic liver diseases, such as liver fibrosis, cirrhosis, and hepatocellular carcinoma (HCC), exosomes contribute to disease pathogenesis and progression by modulating several processes, including fibrogenesis, inflammation, oxidative stress, angiogenesis, proliferation, immune response, and cell death [4, 13, 14].
One of the biggest challenges in the field of EVs is their isolation. There are multiple techniques that are currently used and their advantages and disadvantages have previously been reviewed and discussed [15–17]. Despite the emergence of novel techniques, ultracentrifugation (UC) remains the most commonly used technique and the gold standard for EVs isolation [18]. The two most used UC methods are differential UC (DUC) and density gradient centrifugation (DGC). Both methods are based on centrifugal force to separate particles according to their size, form, and density. DGC uses a density gradient medium, usually sucrose or iodixanol. DUC is an excellent technique to handle large volumes of samples and obtain highly concentrated preparations of EVs at a low cost, which has established it as the “standard method”. The disadvantages of this method are the presence of large particles and contaminants in the EV preparations, labor intensity and dependency of the quality of separation on the rotor type and sample viscosity [19]. There is no generally accepted standard protocol for DUC yet, but generally, it consists of two low-speed centrifugation steps followed by a UC step. Additional washing steps can be included to further purify the sample.
The aim of this study is to determine the optimal DUC protocol for the isolation and characterization of small EVs in plasma and serum samples from patients with liver diseases, as well as for the isolation and characterization of EVs from culture media of hepatic cells to further enhance our understanding of EVs in liver-related diseases and facilitate potential diagnostic and therapeutic applications.
Blood was collected from participants after providing written informed consent. We included a cohort comprising 100 plasma samples from patients with ESLD and 50 plasma samples from healthy kidney donors serving as controls, procured from individuals enlisted in the TransplantLines Cohort and Biobank Study (ClinicalTrials.gov identifier: NCT02811835) at the University Medical Center Groningen, which was approved by the Medical Ethics Committee (METc 2014/077) and in accordance with the guidelines of the Declaration of Helsinki. This is an ongoing, prospective study that aims to provide a better understanding of the causes of disease-related and aging-related outcomes and health problems, both physical and psychological, in solid organ transplant recipients and donors. From June 2015, all solid organ transplantation patients, and donors (aged ≥ 18 years) of the University Medical Center Groningen (UMCG, The Netherlands) were invited to participate.
Additionally, serum samples were obtained from 10 Hispanic and 10 Caucasian healthy volunteers to evaluate the applicability and compare between samples.
Blood was drawn after an overnight fasting period of 8–12 h in the morning using a 0.75-inch (19 mm) butterfly collector (#367284, BD Vacutainer, Becton, Dickinson, NJ, US) in 3 mL sodium citrate tubes (#369714, BD Vacutainer). Immediately after being collected, samples were centrifuged at 2,500 g for 10 min and the liquid was stored in 0.5 mL aliquots at –80°C (−112°F) until use, avoiding freeze-thaw cycles.
Plasma citrate samples (1 mL) were thawed at room temperature (24°C) and transferred into 5 mL (13 × 51 mm) tubes (#344057, Beckman Coulter Inc., Brea, CA, US). Samples were diluted using cold phosphate-buffered saline [phosphate buffered saline (PBS), 1×] (#10010023, Gibco, Thermo Scientific, Carlsbad, CA, US) and tubes were placed into a SW 55 Ti swinging-bucket rotor, k factor 48 (#342196, Beckman Coulter Inc).
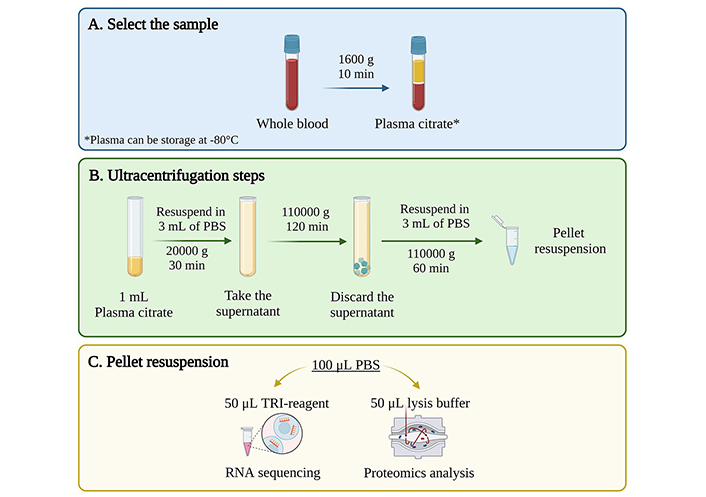
All centrifugation steps were performed at 4°C. The UC consisted of a three-step protocol adapted from Helwa et al. [20] (Figure 1). The first step was a 30-minute cycle at 20,000 g. The supernatant was collected, and the pellet was discarded. The supernatant was placed in 5 mL ultra-clear tubes and centrifuged at 110,000 g for 2 h. After centrifugation, the supernatant was discarded, and the pellet was resuspended in cold PBS. Finally, samples were submitted to a final “washing” step at 110,000 g for 1 h. The pellet was resuspended in 100 μL of PBS (PBS-EVs) or directly into lysis buffer or RNA extraction solution for further analysis.
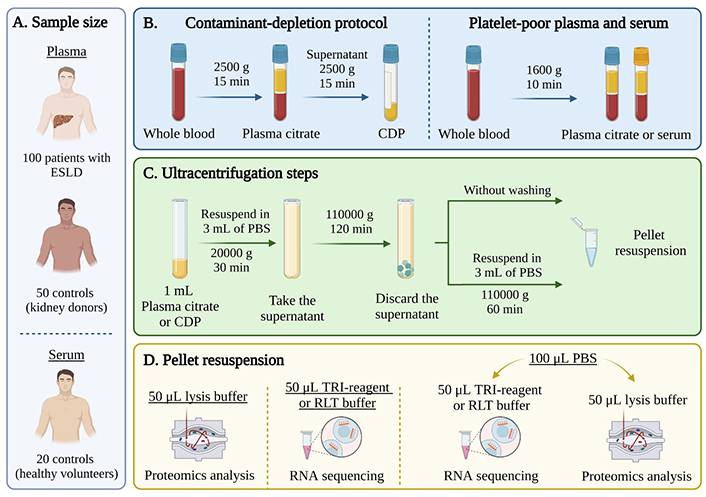
EVs isolation from human plasma and serum samples using ultracentrifugation. (A) A cohort of 100 patients with ESLD and 50 controls from the TransplantLines Biobank for plasma and 20 healthy volunteers for serum were included in the study; (B) after blood collection, plasma and serum were separated using two protocols: a contaminant-depleted plasma (CDP) protocol (left) or a traditional platelet-poor plasma/serum separation protocol (right); (C) 3-step differential UC: first step at 20,000 g for 30 min, second step at 110,00 g for 2 h and third step at 110,000 g for 1 h. For samples without washing (WW): last step was omitted; (D) the pellet was resuspended either in lysis buffer for proteomics analysis, in TRI-reagent or RLT (lysis buffer) for RNA isolation or in phosphate buffered saline (PBS) to be subsequently divided for both techniques. ESLD: end-stage liver disease. Created with BioRender.com
For samples without washing (WW), the last centrifugation step (110,000 g for 1 h) was omitted. For contaminant-depleted plasma (CDP) samples, separation of plasma from whole blood was achieved by centrifugation at 2,500 g for 15 min. The resulting plasma samples were subjected to a second centrifugation step at 2,500 g for 15 min and then stored under identical conditions [21]. In addition, samples from the first centrifugation step (30 min, 20,000 g) were collected and used as a negative control, since they contained bigger vesicles as well as cell debris.
Fifty microliters of PBS-EVs was mixed with 50 µL of lysis buffer (HEPES 25 mmol/L, Kac 150 mol/L, EDTA 2 mmol/L, NP-40 0.1%, NaF 10 mmol/L, PMSF 1 mmol/L, aprotinin 1 µg/µL, pepstatin 1 µg/µL, leupeptin 1 µg/µL, and DTT 1 mmol/L). Samples were subjected to a series of 4 frost-defrost cycles, followed by centrifugation at 12,000 g for 10 min. The supernatant was collected and processed to be quantified.
Protein concentration was quantified using a colorimetric serial dilution of bovine serum albumin (BSA) assay kit following manufacturer’s instructions (#5000116, Bio-Rad, Hercules, CA, US). Absorbance was determined at 750 nm. The concentration of each sample was determined relative to the BSA curve.
The presence of specific protein markers for EVs [CD9 (#13174S, Cell Signaling, Danvers, MA, US), CD63 (#15363, Santa Cruz Biotechnology, Dallas, TX, US), CD81 (#10630D, Invitrogen, Waltham, MA, US), TSG-101 (#7964, Santa Cruz Biotechnology)] and control proteins [albumin (#A0001, Agilent Technologies, Santa Clara, CA, US), CD41 (#13807, Cell Signaling), and anti-acetyl-histone H4 (HDAC4, #06-866, Sigma-Aldrich, San Luis, MO, US)] were analyzed. Forty micrograms of protein was loaded on 10% SDS-PAGE gels. After electrophoresis at 100 V for 90 min, proteins were transferred onto a nitrocellulose membrane by semi-dry blotting for 30 min and blocked with 5% BSA. Membranes were incubated overnight with the antibodies and after incubation secondary antibodies were added [goat anti-rabbit horseradish peroxidase-labeled secondary antibody (#P0448, Agilent Technologies)] or polyclonal rabbit anti-mouse immunoglobulins/horseradish peroxidase (#Cat P0260, Agilent Technologies). Finally, the blots were analyzed using a ChemiDoc XRS system (Bio-Rad).
Total RNA was isolated from 16 samples using the AllPrep DNA/RNA kit (#80004, Qiagen, Hilden, Germany) or TRI-reagent (#T9424, Sigma-Aldrich) following the manufacturer’s instructions. Samples WW, CDP, or those subjected to the 3-step UC procedure were either directly resuspended in TRI-reagent or RLT buffer (lysis buffer) or resuspended in 50 μL PBS mixed with 50 μL of RLT or TRI-reagent. For the AllPrep DNA/RNA kit protocol, 600 µL of RLT buffer with β-mercaptoethanol was immediately added to the samples, followed by vigorous vortexing for at least 1 min. The lysate was then transferred to a gDNA eliminator spin column and after centrifugation, the flow-through was saved. Subsequently, 600 µL of 70% ethanol was added to the flow-through and mixed by pipetting. The mixture was then transferred to an RNeasy spin column, centrifuged and the flow-through was discarded. This step was repeated, and additional washes were performed using RW1 buffer and RPE buffer. Finally, the column was subjected to high-speed centrifugation and the RNA was eluted with 30 µL of RNAse-free water.
For TRI-reagent RNA isolation, 0.2 mL of chloroform per mL of TRI-reagent was added, shaken vigorously for 15 s and allowed to stand for 2–15 min at room temperature. The mixture was centrifuged at 12,000 g for 15 min at 2–8°C. The aqueous phase was then transferred to a fresh tube and 0.5 mL of isopropanol was added per 0.75 mL of TRI reagent used for the initial homogenization. The sample was allowed to stand at room temperature for 5–10 min to precipitate the RNA. After centrifugation, the supernatant was carefully removed and the RNA pellet was washed with 75% cold ethanol. Following another centrifugation step, the RNA pellet was briefly dried and then solubilized using an appropriate volume RNase free water (20 μL). The solubilization process involved pipetting and incubation at 55–60°C for 10–15 min. The RNA concentration and purity were measured using a NanoDrop 2000 Spectrophotometer (ND-2000, Thermo Scientific, Wilmington, DE, US), and the samples were stored at –80°C for further analysis.
Size, size distribution, and quantity of EVs were analyzed by nanotracking analysis (NTA) using a Nanosight LM14 (Malvern Panalytical, Malvern, UK) with blue laser (404 nm, 70 mW) and a sCMOS camera (Hamamatsu Photonics, Hamamatsu, Japan). For NTA, samples were resuspended in 1 mL of PBS. Before each measurement, the equipment was calibrated with 100 nm polystyrene particles and a blank measurement was taken. Samples were injected using a 1 mL syringe and the focus was adjusted to avoid blur particles. Five captures of 60 s each were taken. Once completed, the analysis was done using the NTA software version 3.0. Measurements were performed using a threshold setting of 5 and blue cross count was limited to 5.
Freshly isolated samples were fixed with 2% paraformaldehyde in 0.1 mol/L PBS in a ratio of 1:10 and stored at 20°C until viewing. For transmission electron microscopy (TEM), samples were placed onto a Formvar/Carbon 300 Mesh (#FCF300CU50, Sigma-Aldrich) grid and allowed to air dry for 10 min. Next, the grids underwent initial contrast with a uranyl-oxalate solution, followed by further contrast and embedding using a 4% uranyl acetate mixture. After air drying, visualization of the grids was carried out using a Philips Tecnai 12 (BioTwin, Eindhoven, The Netherlands) electron microscope at 80 kV. The images were then captured utilizing the Item Olympus Soft Imaging Solutions software (Windows NT 6.1).
A total of 20 samples were isolated using the 3-step UC protocol. Half of the samples underwent protein lysis (10 samples), following the previously described protein isolation method and the other half did not (10 samples).
For proteomic analysis, samples with a fixed total protein amount (25 µg) were loaded onto a precast 4–12% Bis-Tris Protein Gels (#NP0335BOX, Invitrogen) and electrophoresis was performed for a maximum of 5 min at 100 V. The gel was stained with Biosafe Coomassie G-250 Stain (#610786, Bio-Rad) and one band containing all proteins was excised from the gel. Gel pieces were subjected to multiple washes. First, they were washed with a solution containing 70% 100 mmol/L NH4HCO3 in water and 30% acetonitrile, followed by a wash with 50% 100 mmol/L NH4HCO3 in water and 50% acetonitrile. The final wash involved 100% acetonitrile for 5 min, and the gel pieces were then dried at 37°C. For reduction and alkylation, gel pieces were covered with 10 mmol/L DTT in 100 mmol/L NH4HCO3 and incubated at 55–60°C for 30 min. Next, 55 mmol/L iodoacetamide in 100 mmol/L NH4HCO3 was added and the mixture was shaken in the dark for 30 min. Subsequently, the gel pieces were washed again with 100% acetonitrile, followed by another drying step at 37°C. For trypsin digestion, a 1:100 ratio of trypsin to gel pieces was prepared in 100 mmol/L NH4HCO3, ensuring the gel plugs were fully submerged. The mixture was centrifuged briefly and then incubated overnight at 37°C. The next day, peptides were eluted from the gel pieces with 50 µL 75% v/v acetonitrile plus 5% v/v formic acid (incubation 20 min at room temperature, mixing at 500 rpm). The organic solvents were removed using a SpeedVac Vacuum (Thermo Scientific) and resuspended in 40 µL 0.1% v/v formic acid for further analysis.
Discovery mass spectrometric analyses were performed on a quadrupole orbitrap mass spectrometer (MS) equipped with a nano-electrospray ion source (Orbitrap Exploris 480, Thermo Scientific). Chromatographic separation of the peptides was performed by liquid chromatography (LC) on an Evosep system (Evosep One, Evosep, Odense, Denmark) using a nano-LC column (EV1137 Performance column 15 cm × 150 µm, 1.5 µm, Evosep; buffer A: 0.1% v/v formic acid, dissolved in Milli-Q H2O, buffer B: 0.1% v/v formic acid, dissolved in acetonitrile). The digests were injected in the LC-MS with 20 µL of the peptide digests and the peptides were separated using the 30SPD workflow (Evosep). The MS was operated in positive ion mode and data-independent acquisition (DIA) mode using isolation windows of 16 m/z with a precursor mass range of 400–1,000, switching the field asymmetric waveform ion mobility spectrometry (FAIMS) between compensation voltage (CV) 45 V and 60 V with three scheduled MS1 scans during each screening of the precursor mass range. LC-MS raw data were processed with Spectronaut (version 17.5.230413, Biognosys) using the standard settings of the direct DIA workflow except that quantification was performed on MS1, with a human Swiss-Prot database (www.uniprot.org, 20,350 entries). For the quantification, local normalization was applied, and the Q-value filtering was set to the classic setting.
Data with ≥ 75% of missing values (0) was filtered, and missing value was imputed using the missForest package (version 1.5). Differential expression analysis was conducted using the DESeq2 package (version 1.40.2) in R (version 3.6.0) using a threshold of false discovery rate (FDR) P < 0.1 and fold-change > 2. The “plotPCA” function from the “DESeq2” package in R was utilized to perform a principal component analysis (PCA). EVs-related markers and contaminants were identified and plotted using GraphPad Prism 5.0 (GraphPad Software, San Diego, CA, US). To visualize the patterns of protein expression and identify significant changes between conditions, a heatmap analysis was employed. The “heatmap.2” function was used based on samples using a threshold of log2-fold change (LFC) > 1.5 and a baseMean > 100. Row scaling was applied to emphasize relative differences in expression patterns.
EVs were isolated from 1 mL of plasma from healthy kidney donors (50 samples) or ESLD patients (100 samples), and 1 mL of serum from healthy volunteers (20 samples) (Figure 1A). The separation of plasma and serum, the CDP protocol as well as the different UC EV and resuspension protocols are shown in Figure 1B–D.
Platelet-poor plasma and serum samples were isolated following the 3-step UC protocol (20,000 g × 30 min, 110,000 g × 2 h, and 110,000 g × 1 h). Randomized samples were used for EVs characterization and representative experiments from plasma or serum are shown in Figure 2. Small EVs were isolated in both serum and plasma samples from patients and controls as demonstrated by the presence of EVs specific markers (CD63, CD9, CD81, TSG-101). Contaminants such as platelets (CD41) or cell debris (HDAC4) were absent in plasma; however, HDAC4 was present in serum EVs (Figure 2A and B). Albumin, which is present at high abundance, was not completely removed from either group of samples (Figure 2A and B), and was not significantly different between healthy control plasma or serum samples (Figure 2C). NTA was employed to determine the size distribution of the particles, revealing the presence of particles with an average size of 181.4 nm and a peak at 125.1 nm from plasma and 207.7 nm and 182.4 nm respectively for serum (Figure 2E and F). TEM images demonstrate the presence of ‘collapsed’ cup-shaped structures as a consequence of dehydrated bilipid membranes of the EVs, with an average size below 200 nm in plasma samples (Figure 2D). These findings allude to successful small-EVs isolation.
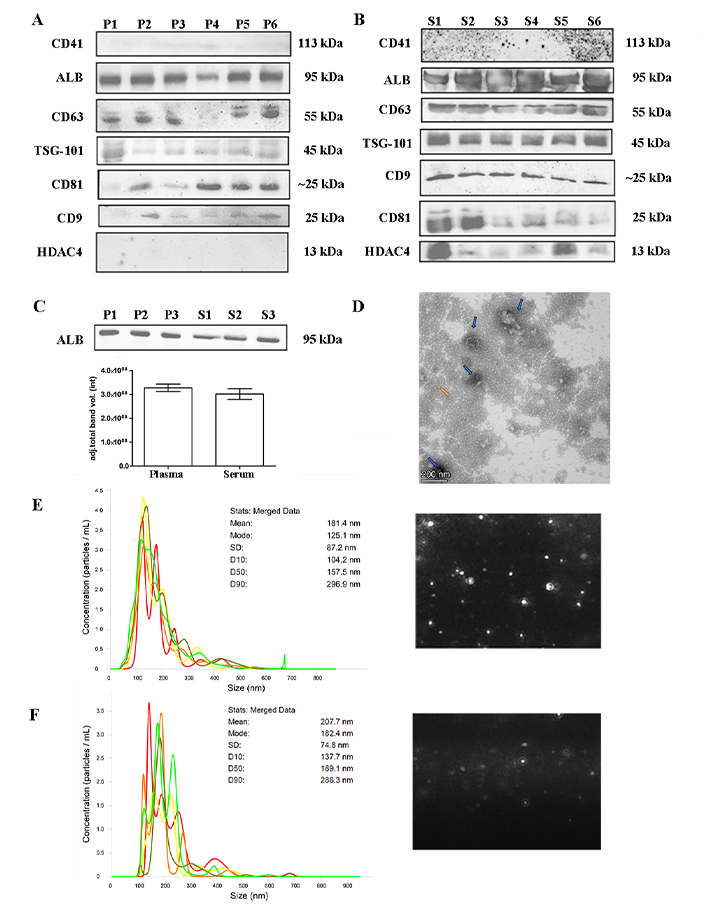
EVs characterization. (A) and (B) western blot showing representative samples subjected to the 3-step protocol. Plasma or serum samples were separated on 10% SDS-PAGE gels (40 μg) and probed with CD9, CD41, CD63, CD81, TSG-101, ALB, and HDAC4 primary antibodies; (C) quantification of ALB band intensity between plasma and serum of healthy controls. Unpaired two-tailed t-test (not significant); (D) negatively stained with 2% uranyl acetate TEM pictures showing cup-shaped structures (blue arrow) with 135–186 nm size were identified (contaminants: orange arrow), scale bars: 200 nm; (E) and (F) nanotracking analysis (NTA, NanoSight LM14, 404 nm, 70 mW) of EVs showing 5 captures of 60 s. Mean diameter of 181.4 nm and a peak of 125.1 nm for plasma samples and a mean diameter of 207.7 nm and a fashion of 182.4 nm for serum samples. ALB: albumin; EVs: extracellular vesicles; HDAC4: anti-acetyl-histone H4; P: plasma samples; S: serum samples; TEM: transmission electron microscopy; TSG-101: tumor susceptibility gene 101
In our study, the isolation of EVs from plasma and serum exhibited similarities; however, after careful consideration, we opted for plasma as our preferred starting material. The decision was based on two key advantages. First and foremost, the preservation of EVs in their native state is crucial for accurate analysis, and plasma minimizes alterations in the EV population that may occur during clotting in serum. Secondly, the simplified and quicker handling of plasma contributes to the overall efficiency of our experimental procedures.
Since our plasma samples showed variation in protein markers despite loading the same amount of protein (40 μg), we considered there could be technical differences regarding the isolation procedure as well as variance depending on the health status of each subject (ESLD diagnosis, stage, medication, etc.). Hence, to improve the isolation yield of EVs and thereby increasing the total amount of protein, the protocol was modified and the last “washing” centrifugation step was omitted (WW), additionally, samples from healthy controls were used. As a control, the pellet from the first centrifugation step (1st), containing apoptotic bodies and cell debris, was used for characterization.
Twenty WW samples from healthy controls (kidney donors or volunteers) were analyzed (Figure 3). The presence of EV markers was similar in the samples from the 3-step centrifugation protocol (Figure 3A), except for CD9, which showed an increased intensity in the WW samples. However, platelets (CD41) and cellular debris (HDAC4) showed no reduction in the WW samples. Samples from the first centrifugation step were also analyzed and although they did show the presence of EVs-related proteins, other contaminants were also increased (Figure 3B). Albumin contamination was also higher in both groups compared to the 3-step UC samples, although not significantly different (Figure 3C). Overall, although it appeared that the yield of EVs was higher in the WW samples, there was a reduction in the purity of the samples. NTA analysis and TEM also showed the presence of artifacts with different particle sizes in the WW samples (Figure 3D–F).
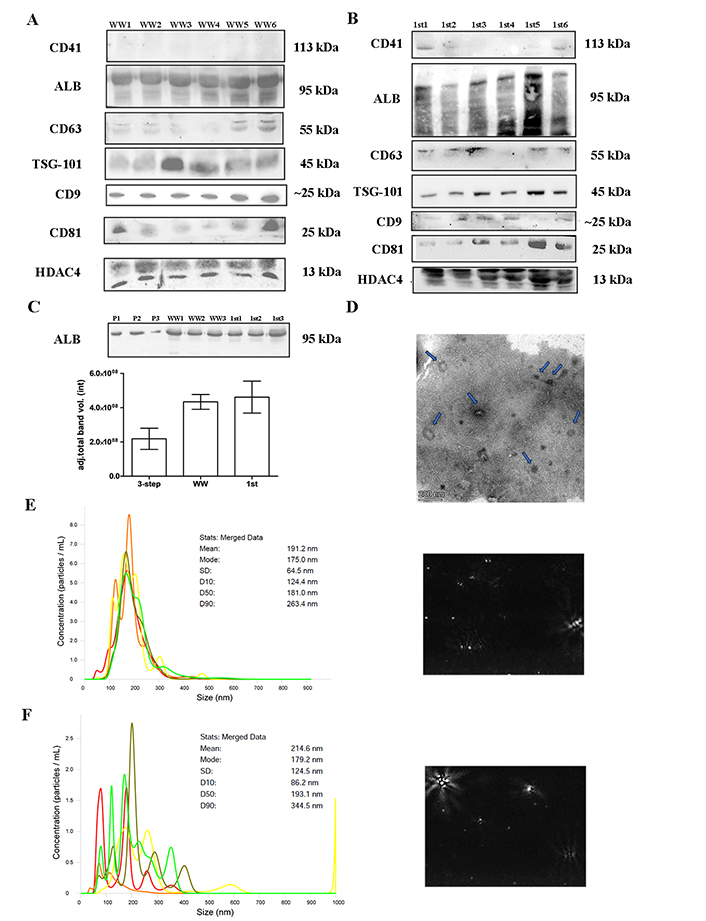
EVs characterization. Twenty samples of healthy controls were UC (20,000 g × 30 min and 110,000 g × 2 h) omitting the last centrifugation step and analyzed. (A) and (B) western blot showing WW or 1st step UC samples separated on 10% SDS-PAGE gels (40 μg) and probed with CD9, CD41, CD63, CD81, TSG-101, ALB, HDAC4 primary antibodies; (C) quantification of ALB band intensity between WW and 1st UC samples, in contrast with the 3-step protocol; (D) TEM pictures negatively stained with 2% uranyl acetate of WW samples showing cup-shaped structures (blue arrow). Scale bars: 200 nm; (E) and (F) nanotracking analysis (NTA, NanoSight LM14, 404 nm, 70 mW) shows 5 captures of 60 s, with a mean diameter of 191.2 nm and a fashion of 175.0 nm for WW samples and a mean diameter of 214.6 nm and a fashion of 179.2 nm for 1st step samples. ALB: albumin; EVs: extracellular vesicles; HDAC4: anti-acetyl-histone H4; TEM: transmission electron microscopy; TSG-101: tumor susceptibility gene 101; UC: ultracentrifugation; WW: samples without washing
Since the omission of the washing step did not lead to a significant improvement of the yield and reduced the purity of the EVs, the 3-step centrifugation protocol was maintained. However, a modification to the plasma collection process to eliminate contaminants was introduced. Twenty samples from healthy controls were collected and centrifuged at 2,500 g for 10 min to separate plasma from whole blood. Next, a second centrifugation at 2,500 g for 15 min was performed to obtain platelet-poor plasma before proceeding with the 3-step isolation protocol. These samples were named CDP samples. The results showed that EVs markers were present, while platelets and cell debris were no longer observable (Figure 4). However, albumin was still detectable to the same extent as the samples isolated with the original 3-step centrifugation protocol (Figure 4C). The NTA analysis (Figure 4B) indicated that the particles had a mean size of 191.8 nm and a peak of 184.6 nm, confirming the presence of small EVs. TEM (Figure 4D) showed a reduction in contaminants, but also the EVs quantity was decreased. Therefore, although EVs were of higher purity than the EVs obtained with the original 3-step UC procedure, the yield of EVs was slightly compromised. Considering these findings, it was concluded that the 3-step plasma UC protocol is the most suitable approach to obtain EVs for further analysis.
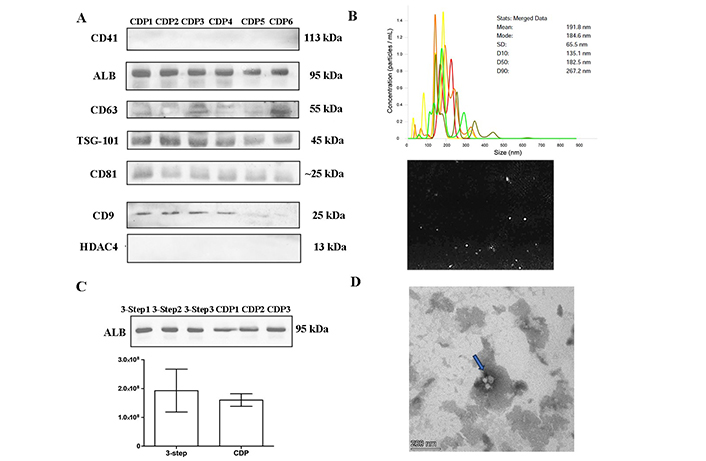
EVs characterization. Twenty samples of healthy controls were depleted of contaminants (2,500 g × 10 min and 2,500 g × 15 min) and later UC using the 3-step protocol (CDP). (A) Western blot of CDP protocol samples separated by 10% SDS-PAGE gels (40 μg) and probed with CD9, CD41, CD63, CD81, TSG-101, ALB, and HDAC4 primary antibodies; (B) nanotracking analysis (NTA, NanoSight LM14, 404 nm, 70 mW) shows 5 captures of 60 s, with a mean diameter of 191.8 nm and a fashion of 184.6 nm; (C) quantification of ALB band intensity: comparison of CDP samples and healthy controls samples subjected to the 3-step protocol; (D) TEM pictures, negatively stained with 2% uranyl acetate, showing cup-shaped structures (blue arrow). Scale bars: 200 nm. ALB: albumin; CDP: contaminant-depleted plasma; EVs: extracellular vesicles; HDAC4: anti-acetyl-histone H4; TEM: transmission electron microscopy; TSG-101: tumor susceptibility gene 101; UC: ultracentrifugation
For protein quantification, samples from healthy controls (kidney donors or volunteers) that underwent the first-step centrifugation, WW, CDP, and with the complete 3-step UC protocol were quantified using BSA protein assay kit. Differences within samples revealed that samples from the first step (20,000 g for 30 min) of UC and WW had higher protein concentration compared to the CDP and 3-step UC samples (Figure 5). However, the isolated amount in all procedures was sufficient to demonstrate the presence of EVs via western blot.
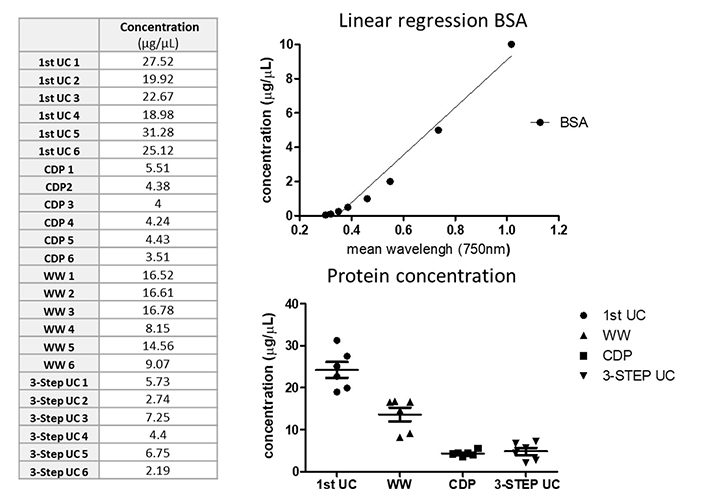
EVs quantification. Sixteen plasma samples from healthy controls were used for protein and RNA quantification. Protein was extracted from samples after the first centrifugation step, CDP, WW, and the 3-step protocol isolation and quantified using a colorimetric serial dilution of BSA assay; BSA linear regression concentration is shown in the upper graph while the bottom graphs show differences among protocols. BSA: bovine serum albumin; CDP: contaminant-depleted plasma; UC: ultracentrifugation; WW: samples without washing
Two methods were evaluated for RNA isolation, TRI-reagent, and the RNA isolation kit AllPrep DNA/RNA kit (Qiagen). Sixteen plasma samples from healthy controls (kidney donors or volunteers) using the UC protocol WW, CDP and 3-step UC procedures were selected. Additionally, since samples were resuspended in PBS, we evaluated whether the RNA purity (260/280 nm ratio) was affected. Six samples were resuspended directly in TRI-reagent or RLT buffer and 10 samples were first resuspended in PBS (50 μL). RNA concentration was determined by measuring absorbance at 260 nm on a spectrophotometer, quantification shows that the AllPrep DNA/RNA kit (RLT buffer) was not suitable for the RNA extraction of our samples regardless of the RNA isolation procedure (Table 1). TRI-reagent alone or in combination with PBS allowed the extraction of high amounts of RNA in WW and 3-UC step prepared samples (Table 1). These findings confirm successful protein and RNA isolation from our EV samples.
RNA quantification of samples subjected to different protocols and resuspended in TRI-reagent or RLT buffer extracted by RNeasy Mini kit (Qiagen, Hilden, Germany) or TRI-reagent (Sigma-Aldrich)
| Samples | Concentration (ng/μL) | Absorbance (260/280 nm) |
|---|---|---|
| 3-step UC | ||
| PBS + RLT (AllPrep kit) | 4.1 | 2.19 |
| 2.4 | 3.05 | |
| 1.1 | 3.08 | |
| TRI-reagent + PBS | 782.4 | 1.78 |
| 1,045.1 | 1.82 | |
| 1,185.0 | 1.58 | |
| RLT (AllPrep kit) | 7.7 | 3.05 |
| TRI-reagent | 1,281.9 | 1.71 |
| WW | ||
| TRI-reagent + PBS | 1,087.6 | 1.71 |
| 1,321.9 | 1.71 | |
| 1,281.9 | 1.64 | |
| PBS + RLT (AllPrep kit) | 1.0 | 1.62 |
| RLT (AllPrep kit) | 0.8 | 0.12 |
| TRI-reagent | 486.1 | 1.43 |
| CDP | ||
| RLT (3-step, AllPrep kit) | 13.5 | 1.45 |
| RLT (WW, AllPrep kit) | 0.6 | 3.05 |
CDP: contaminant-depleted plasma; PBS: phosphate buffered saline; UC: ultracentrifugation; WW: samples without washing
Once the UC isolation method (3-step) was selected, samples from ESLD-patients were analyzed via proteomics. First, we determined the necessity of traditional cell lysis for protein isolation, considering that EVs are already extracellular components. Since the proteomics sample preparation process involves the use of solvents that can disrupt the lipid membrane surrounding EVs, a comparative analysis by testing 10 samples with traditional lysis (L) and 10 samples without lysis (NL) was performed, as described in the Materials and methods section of our study.
A total of 1,171 proteins (average) were identified. Data with ≥ 75% of missing values (0) were filtered and 688 proteins remained. To gain insights into the overall variation in the data and the clustering of samples, PCA was conducted (Figure 6A). Our PCA analysis revealed a distinct separation between L and NL along the first principal component (PC1), which explained 22% of the total variance. This clear separation suggests that the two groups exhibit significant differences in their underlying data patterns. At the same time, it shows that there is variability within each group since no cluster was observable, indicating that there are specific characteristics of each sample that contribute to it (i.e., ESLD etiology).
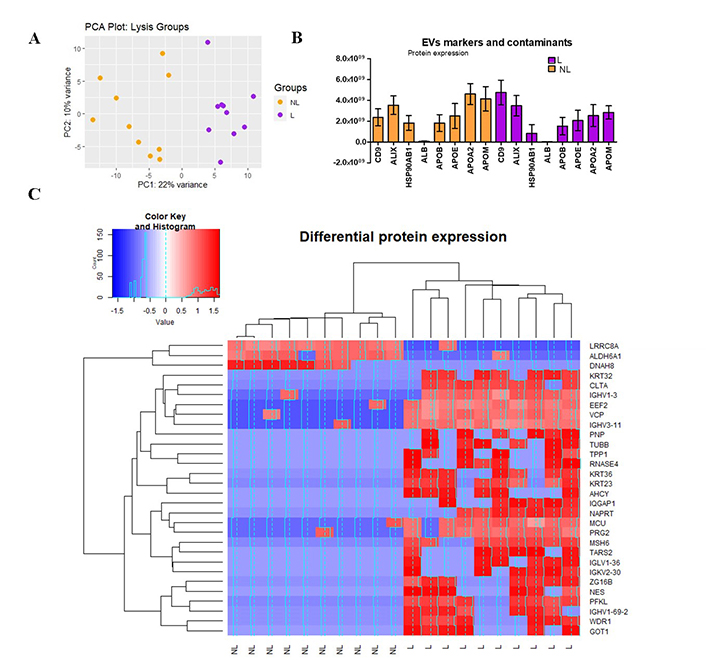
Proteomics analysis. (A) PCA, the scores of samples from Lysis (L, purple) and non-lysis (NL, orange) are shown. The first two principal components (PC1 and PC2) explain 22% and 10% of the total variance, respectively; (B) expression of CD9, ALIX, HSP90AB1, ALB, and APOE, APOB, APOA2, APOM; (C) heat map of z-scores (calculated from log2-transformed protein intensities) and hierarchical clustering of protein expression data. Color key indicates the level of expression (blue = downregulated, red = upregulated). The histogram in the color key represents a density plot of the frequency of distance values. ALB: albumin; ALDH6A1: aldehyde dehydrogenase 6 family member A1; APOE: apolipoprotein E; GOT1: glutamic-oxaloacetic transaminase 1; MCU: mitochondrial calcium uniporter; PC: principal component; PCA: principal component analysis; PFKL: phosphofructokinase
To properly select one of the methods (NL or L), a comprehensive analysis was conducted to delineate the distinctions between them. Figure 6B illustrates the presence of EV-specific markers, including CD9, ALIX, and HSP90AB1, alongside various contaminant proteins such as albumin and lipoproteins [apolipoprotein E (APOE), APOB, APOA2, APOM]. While the expression levels of HSP90AB1 and ALIX were relatively comparable across both groups, it was noteworthy that lysed samples exhibited a twofold increase in CD9 expression compared to non-lysed samples. This finding suggests that lysed samples demonstrate heightened specificity in detecting EV-related markers, indicating enrichment of EV-related proteins in this group. Conversely, the levels of lipoproteins exceeded those of albumin in both groups and mirrored the patterns observed with specific EV markers. Notably, other lipoproteins, including APOL1, APOA1, APOC1, APOC2, APOC3, APOH, APOD, APOA4, APOC4, APOF (data not shown), were also expressed, with only the more substantial increases being highlighted.
Finally, in the protein expression analysis, of the 688 proteins with an adjusted P-value < 0.1, we observed significant changes in protein expression levels based on the LFC values between groups (L versus NL, Figure 6C). Among the significant proteins, 27 (3.8% of the total) showed overexpression, while only 3 (0.43% of the total) exhibited under expression when comparing the L samples to the NL ones. To conclude whether their increase or reduction is significant for liver-related diseases it is necessary to correlate the clinical data of every individual with its corresponding output.
From these results, we concluded that L group has an increased protein yield, with an increased abundance of EVs-specific markers, making lysis of samples the preferred method for subsequent analysis.
EVs were discovered by Chargaff and West in 1946 who described them as “products of the blood corpuscles” with clotting properties [22]. The field has grown since then at a low pace, but there has been exponential growth in the last decade thanks to novel proteomics and genomics technologies allowing detailed characterization of their cargo.
There is a high concentration of EVs in circulating blood (approximately 1010 EVs/mL) [23], hence the study of EVs in whole blood or its derivates has been extensively studied. The majority of circulating EVs are secreted by blood cells. Nonetheless, there is a subpopulation of EVs coming from different origins such as liver cells [24]. Hepatic cells can also capture EVs coming from other sources, regulating various (patho)physiological aspects [7]. Therefore, there is a great interest in EVs as a potential source of novel biomarkers for monitoring, diagnosing, or even for treatment of different liver diseases [25, 26]. ESLD is a major cause of morbidity and mortality worldwide [27] and liver transplantation is the only curative treatment. Therefore, understanding pathophysiological communication via EVs as well as identifying novel EV-based biomarkers could improve the early detection of patients predisposed to complications [28].
In the pursuit of this objective, we performed an exhaustive study to standardize and validate the optimal protocol for EVs isolation from plasma or serum samples of ESLD patients within the TransplantLines cohort of our medical center (UMCG). We used differential UC since this technique is easy to perform and allows for handling large batches of samples at a relatively low cost with an intermediate recovery and specificity [29]. Different protocols were studied: 1) a 3-step centrifugation protocol, performed in plasma and serum, which included a first-step to remove larger particles such as apoptotic bodies and cellular debris (20,000 g × 30 min), a second-step to pull down small and medium size particles (110,000 g × 2 h), and a third-step to remove smaller cellular debris and microvesicles (110,000 g × 1 h). 2) WW protocol, in which the last washing step was omitted to reduce EVs lost. 3) A platelet poor plasma (PPP) protocol, in which a centrifugation step was added (1,600 g × for 10 min) to reduce platelets and other contaminants such as lipoproteins or albumin.
To demonstrate EVs isolation, specific protein markers were shown via western blot and proteomics. Additionally, their size and presence were analyzed using NTA and TEM. We were able to show EVs detection of specific proteins (CD9, CD63, CD81, and TSG-101) in plasma and serum samples. Furthermore, the size of the isolated EVs was in accordance with that of small vehicles (≥ 120 nm).
In the context of EV isolation, concerns have been raised regarding the potential co-isolation of contaminants such as protein aggregates, RNA-protein complexes, and lipoproteins, which may share similarities in size, shape, or density with EVs. Purity yield was determined by the abundance of albumin and platelets (western blot). We showed that the 3-step and CDP protocols for plasma samples result in diminished contamination by platelets (CD41), albumin, or apoptotic bodies (HDAC4) in comparison with samples isolated from the first centrifugation step only or without washing. However, contamination with albumin was not completely removed (later confirmed via proteomics). To achieve that, different techniques (e.g., immunoaffinity, charge-based precipitation, or nanoplasmon-enhanced scattering) or the combination of DUC with size-exclusion chromatography or ultrafiltration should be considered. However, it is important to note that some of these approaches result in a lower recovery rate despite achieving a higher purity [19, 30].
Lipoproteins and chylomicrons share a similar size range (5–1,200 nm) and density with EVs. Moreover, their high abundance in blood (20–100 times more than EVs) poses a challenge in distinguishing them from EVs [31]. Importantly, lipoprotein concentration tends to increase after postprandial metabolism, underscoring the significance of an 8–12 h fasting period. In our study, samples were collected following such a fasting period, thus, we anticipate that lipoprotein concentration levels remained stable. While we successfully investigated other contaminants, such as albumin, using western blot, we failed on assess lipoprotein presence via this technic. Nevertheless, our proteomic data unveiled the existence of lipoproteins, demonstrating expression levels comparable to those of EV markers. This observation underscores the difficulties associated with separating EVs from these lipid components. Various strategies can be employed to overcome this challenge, including combining techniques such as size exclusion chromatography (SEC) with a density cushion [31] or utilizing alternative isolation methods like acoustofluidic methods [32]. These approaches can enhance the specificity of EV isolation and mitigate interference from lipoproteins, providing more accurate insights into EV-related analyses.
The protein concentration and profile observed in our study exhibited significant variability among the samples. To study the origins of this variability, a comprehensive characterization of our patient cohort must be done taking into consideration the etiology of the ESLD, age, gender, ethnicity, and other pertinent clinical parameters that can impact the profile of the EVs. Furthermore, the multifaceted origins of EVs and the heterogeneity of these nanoparticles add complexity to the observed variations [32]. Finally, technical (human) errors could also influence the variability, despite steps being taken to mitigate their impact.
The cargo of EVs is composed of different molecules like DNA, RNA, lipids, proteins, and metabolites. RNA and proteins had been used as biomarkers; thus, their isolation was studied to determine whether our protocol was compatible with further proteomics or genomics analysis. RNA extraction was done employing two protocols: TRI-reagent and the AllPrep DNA/RNA Mini kit. Our results showed that the TRI-reagent, but not the commercial kit, was successful in RNA extraction. Similarly, Prendergast et al. [33], undertook a comprehensive comparison of RNA extraction techniques involving the RNeasy Mini kit, TRIzol and the AllPrep DNA/RNA kit. Their findings are in accordance with our observations, as the AllPrep DNA/RNA kit exhibited limited efficacy in RNA extraction, while both commercial kits and TRIzol demonstrated successful outcomes. Our extracted RNA displayed an OD 280/260 ratio ranging from 1.4 to 3.08, indicating potential contamination by proteins, DNA or solvents, indicating the need for supplementary purification measures, such as the inclusion of precipitation steps (utilizing ethanol, isopropanol or lithium chloride), DNase treatment, chromatographic techniques or even the exploration of alternative commercial RNA isolation kits before continuing with RNA sequencing [33].
Effective protein extraction is a critical component in achieving comprehensive protein characterization. In pursuit of this, we conducted an evaluation of both lysed and non-lysed samples. Our rationale for this approach stems from the understanding that EV proteins are inherently integrated within the membrane, and the inner proteins might already be released since there is potential damage to membrane integrity during LS/MS preparation, which includes trypsinization and in-gel digestion. Notably, the choice of the lysis method can potentially influence the protein profile in LS/MS analysis due to factors such as solubility and buffer ionization, as indicated by previous research [34–36]. Our findings are in line with this since a distinct difference between the two groups emerged.
When comparing lysed and non-lysed samples, lysed samples exhibited increased CD9 expression, suggesting that the lysed group possesses a broader capability to detect EV-related proteins. Furthermore, the differential expression analysis demonstrated that the entire protein profile was more abundant in lysed samples.
Among the identified proteins, three play crucial roles in amino acid [aldehyde dehydrogenase 6 family member A1 (ALDH6A1), glutamic-oxaloacetic transaminase 1 (GOT1)] and glucose metabolism [phosphofructokinase (PFKL)]. Given the exclusive expression of PFKL in the liver and the high, albeit not exclusive, expression of GOT1 and ALDH6A1 in the liver, we considered these proteins as potential markers for liver-origin EVs. ALDH6A1 exhibited overexpression in not lysed samples, while GOT1 and PFKL were found to be overexpressed in lysed samples. This observation hints at a possible hepatic origin, with ALDH6A1 possibly present in intact EVs, while GOT1 and PFKL may be more prevalent in lysed EVs, perhaps released during the lysis process. In both instances, their presence in our samples suggests potential clinical utility as markers for liver diseases. Unfortunately, specific liver-origin EV markers such as ASGPR1 and SLC27A5, as reported by Royo et al. in 2013 [10], were not expressed in our samples.
One identified protein, the mitochondrial calcium uniporter (MCU), is associated with liver disease pathophysiology, particularly with HCC, where elevated MCU expression is associated with poor prognosis [37]. Therefore, the elevated expression of MCU in our dataset could potentially serve as a protein marker for HCC in our cohort.
As for ALDH6A1, GOT1, PFKL, or MCU, validation through different strategies need to be taken under consideration: immunoblotting, enzyme-linked immunosorbent assay (ELISA), or additional MS experiments or utilizing targeted proteomics approaches to confirm the identified proteins. While these validations are crucial, our current success lies in achieving our goal of selecting the most suitable EV isolation method, laying the groundwork for the comprehensive exploration of liver diseases in our ongoing and future research endeavors.
In conclusion, our study has made significant strides in advancing the understanding and utility of EVs, particularly in the context of ESLD. The study successfully detected specific protein markers in plasma and serum samples from healthy controls and ESLD patients within the TransplantLines cohort, demonstrating the efficacy of DUC in isolating EVs (Figure 7). However, challenges in achieving absolute purity, particularly with persistent albumin contamination, highlight the need for further refinement and exploration of alternative techniques to enhance the isolation protocol.
Final protocol for EVs isolation from human plasma samples using ultracentrifugation. (A) Select the samples according to project requirements and availability; ideally, citrate plasma samples, which can be stored at –80°C until use; (B) perform a 3-step differential ultracentrifugation: first at 20,000 g for 30 min, second at 110,000 g for 2 h, and third at 110,000 g for 1 h; (C) resuspend the resulting pellet in different solutions based on downstream analysis needs; resuspension in PBS is recommended for subsequent RNA or protein isolation. EVs: extracellular vesicles; PBS: phosphate buffered saline. Created with BioRender.com
Moreover, our findings underscore the complex nature of EVs, with origins and cargo contributing to significant variability in protein concentration and profiles among samples. The multifaceted nature of EVs, coupled with potential technical errors, emphasizes the importance of a comprehensive patient cohort characterization, considering clinical parameters and ESLD etiology. While promising associations with HCC markers have been identified, additional validation and integration of clinical data are imperative. Overall, our study provides a robust foundation for future investigations into the potential clinical applications of EVs in ESLD, encouraging further research to unlock their diagnostic and therapeutic potential.
ALDH6A1: aldehyde dehydrogenase 6 family member A1
APOE: apolipoprotein E
BSA: bovine serum albumin
CDP: contaminant-depleted plasma
DUC: differential ultracentrifugation
ESLD: end-stage liver disease
EVs: extracellular vesicles
GOT1: glutamic-oxaloacetic transaminase 1
HCC: hepatocellular carcinoma
HDAC4: acetyl-histone H4
HSCs: hepatic stellate cells
LC: liquid chromatography
MCU: mitochondrial calcium uniporter
MS: mass spectrometer
NTA: nanotracking analysis
PBS: phosphate buffered saline
PCA: principal component analysis
PFKL: phosphofructokinase
TEM: transmission electron microscopy
TSG-101: tumor susceptibility gene 101
UC: ultracentrifugation
WW: samples without washing
We kindly thank the participants and the staff of TransplantLines for providing plasma material of pre transplanted patients.
TransplantLines Investigators: Coby Annema, Stefan P. Berger, Hans Blokzijl, Frank A.J.A. Bodewes, Marieke T. de Boer, Kevin Damman, Martin H. de Borst, Arjan Diepstra, Gerard Dijkstra, Rianne M. Douwes, Caecilia S.E. Doorenbos, Michele F. Eisenga, Michiel E. Erasmus, C. Tji Gan, Antonio W. Gomes Neto, Eelko Hak, Bouke G. Hepkema, Marius C. van den Heuvel, Frank Klont, Tim J. Knobbe, Daan Kremer, Coretta van Leer-Buter, Henri G.D. Leuvenink, Marco van Londen, Willem S. Lexmond, Vincent E. de Meijer, Hubert G.M. Niesters, Gertrude J. Nieuwenhuis-Moeke, L. Joost van Pelt, Robert A. Pol, Robert J. Porte, Adelta V. Ranchor, Jan Stephan F. Sanders, Marion J. Siebelink, Riemer J.H.J.A. Slart, J. Cas Swarte, Daan J. Touw, Charlotte A. te Velde-Keyzer, Erik A.M. Verschuuren, Michel J. Vos, Rinse K. Weersma, Stephan J.L. Bakker
MMA: Formal analysis, Investigation, Writing—original draft, Writing—review & editing. MCTA: Formal analysis, Investigation, Writing—review & editing. JCW: Formal analysis, Writing—review & editing. MBH and FVV: Writing—review & editing. All members of TransplantLines: Resources. HB and HM: Conceptualization, Supervision, Writing—review & editing. All authors have read and agreed to the published version of the manuscript.
The authors declare that they have no conflicts of interest.
TransplantLines Cohort and Biobank Study (ClinicalTrials.gov identifier: NCT02811835) was approved by the Medical Ethics Committee (METc 2014/077).
Informed consent to participate in the study was obtained from all participants.
Not applicable.
The raw data supporting the conclusions of this manuscript, including western blot analyses, will be made available by the authors, without undue reservation, to any qualified researcher.
The TransplantLines Biobank and Cohort study was supported by grants from Astellas BV (project code: [TransplantLines Biobank and Cohort study]), Chiesi Pharmaceuticals BV (project code: [PA-SP/PRJ-2020-9136]), and NWO/TTW via a partnership program with DSM, Animal Nutrition and Health, The Netherlands (project code: [14939]). The project was co-financed by the Dutch Ministry of Economic Affairs and Climate Policy by means of so-called PPP-allowances, made available by the Top Sector Life Sciences & Health to stimulate public-private partnerships (project code: [PPP-2019-032] and [PPP-2022-015]). The funders had no role in the study design, data collection, analysis, reporting, or the decision to submit for publication.
© The Author(s) 2024.
Copyright: © The Author(s) 2024. This is an Open Access article licensed under a Creative Commons Attribution 4.0 International License (https://creativecommons.org/licenses/by/4.0/), which permits unrestricted use, sharing, adaptation, distribution and reproduction in any medium or format, for any purpose, even commercially, as long as you give appropriate credit to the original author(s) and the source, provide a link to the Creative Commons license, and indicate if changes were made.

View: 9842
Download: 104
Times Cited: 0
